
The Power of the Board: Does Your Network Determine Your Net Worth?
Interlocking Directorates and Profitability: A Social Network Analysis of Fortune 500 Companies
This study utilizes Social Network Analysis (SNA) to investigate the impact of interlocking directorates on corporate profitability within the 2010 Fortune 500 companies. It identifies a positive linear relationship between both the number of director interlocks and structural power (specifically Bonacich centrality) and a firm's financial performance.
TL;DR
Sitting on multiple boards isn't just about prestige—it’s a strategic lever. This paper analyzes the 2010 Fortune 500 through the lens of Social Network Analysis (SNA) and finds that companies with more director interlocks and "high-quality" connections to other powerful boards tend to report higher profits. However, these network effects are just one small variable in the massive equation of corporate success.
The "Old Boys' Club" or Strategic Synergy?
Why do companies share directors? This question has polarized scholars for decades:
- The Optimists (Resource Dependence Theory): Interlocks are "bridges" that allow companies to trade vital information, secure capital, and reduce environmental uncertainty.
- The Cynics (Class Hegemony Theory): Interlocks are "fortresses" where elites protect their own interests, potentially leading to "busy boards" that are too distracted to monitor management effectively.
The authors of this study stepped into this debate to ask: Does a central seat in the corporate web actually translate to more dollars on the balance sheet?
Methodology: Mapping the Fortune 500 Web
The researchers didn't just count handshakes. They used UCINET to map the structural position of 500 companies based on 4,267 unique directors. They looked at three types of "Power":
- Betweenness Centrality: Does the company act as a gatekeeper between other clusters?
- Closeness Centrality: How many "hops" does it take to reach everyone else?
- Bonacich Power Centrality: Does the company connect to other powerful companies? (The "who you know" factor).
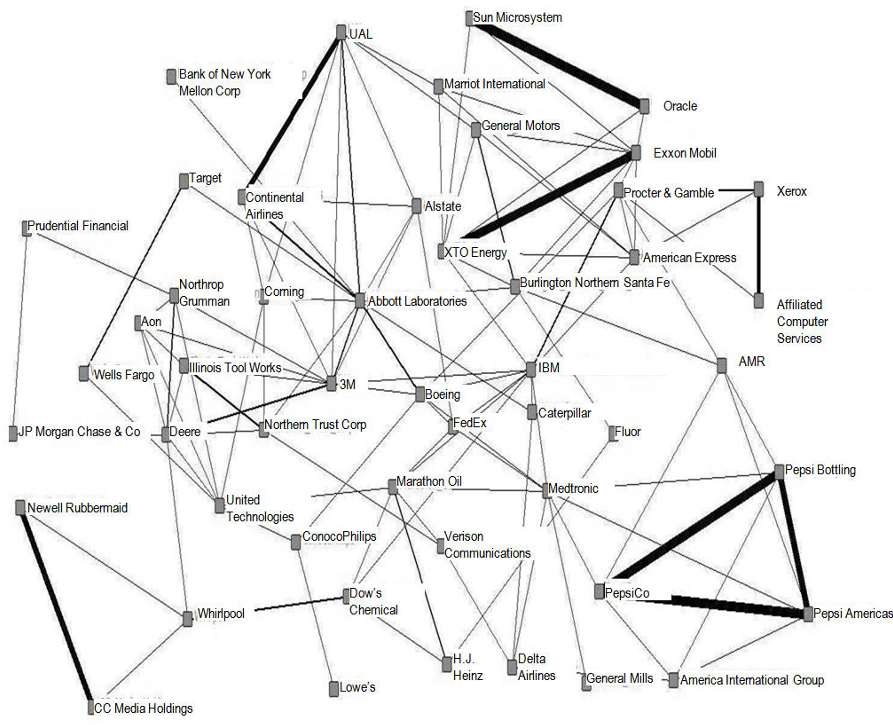 The network visualization above showcases the dense interlocking patterns of the top 50 companies, highlighting that even at the peak of the pyramid, connections are highly concentrated.
Key Findings: Quality Over Quantity
The results provide a nuanced view of corporate influence:
1. The Positive Link
There is a positive linear relationship between the number of interlocks and profitability. This supports the idea that being "connected" helps a firm's bottom line. Interestingly, the study found no evidence of a "curvilinear" relationship—meaning there wasn't a visible point where "too many" interlocks started hurting profits in this dataset.
2. The Nuance of Power
Not all centrality is created equal. Bonacich Power Centrality was a significant predictor, while Closeness was not. This suggests that in the corporate world, it’s better to be connected to a few "titans" than to be a "friend to everyone."
3. The "Complexity" Reality Check
The most humbling finding? The R² values were very low (around 2%). This means that while having a powerful network is statistically significant, it explains only a tiny portion of why a company is profitable. Factors like internal business strategy, market share, and sector dynamics dwarf the "network effect."
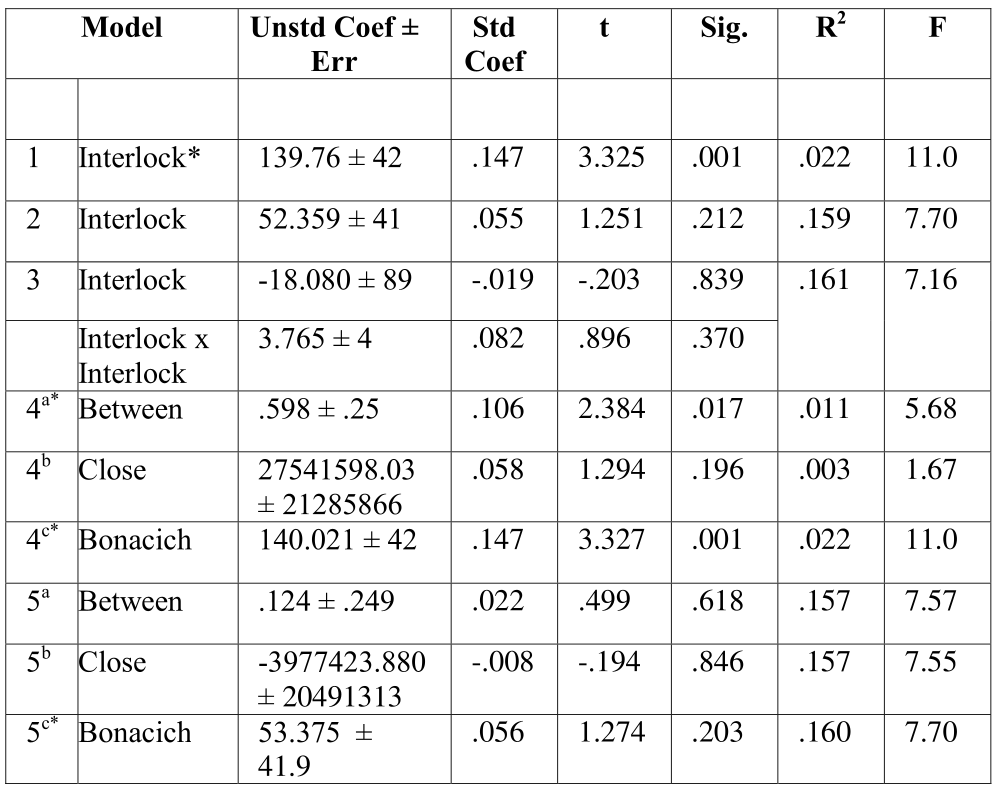 Table 3 reveals that while models for Interlocks and Bonacich Power (Model 1 & 4c) are statistically significant (p < .01), the influence wanes when control variables are introduced.
Critical Insight: The "Synchronicity" Problem
The authors candidly point out a major limitation in board research: Time Lags. A director joined a board in 2005, a network formed in 2008, and the profit was recorded in 2010. These relationships are dynamic, not static. Furthermore, the "inner workings" of a board—the actual conversations and chemistry—remain a "black box" that SNA can map but not fully explain.
Final Takeaway
If you're a CEO, expanding your board's reach into other powerful corporations is likely a net positive for your firm's resource acquisition. However, don't expect the "Rolodex effect" to save a failing business strategy. Networking is the grease on the wheels, but your business model is still the engine.