
Investment Behaviors Can Tell What's Inside: Decoding Stock Intrinsic Properties for Trend Prediction
Investment Behaviors Can Tell What Inside: Exploring Stock Intrinsic Properties for Stock Trend Prediction
The paper proposes a novel stock trend prediction framework that extracts Stock Intrinsic Properties from mutual fund portfolios using Matrix Factorization and integrates them into Deep Neural Networks (SFM/LSTM). By modeling dynamic market states, the method achieves significant performance gains and higher cumulative profits in real-world trading simulations.
TL;DR
While AI has made strides in financial forecasting, professional human traders still hold an edge by understanding "what kind of stock" they are dealing with—its intrinsic nature. This paper bridges that gap by mining Mutual Fund Portfolio data to extract latent stock properties. By combining these static properties with dynamic market trends through a novel Deep Learning architecture, the researchers achieved superior prediction accuracy and higher returns than traditional technical-indicator-only models.
The "Intuition" Gap in Quantitative Trading
Most deep learning models for the stock market operate on a "black box" of technical indicators like Moving Averages or RSI. They treat every stock as just a sequence of numbers. However, a "Cyclical" stock (like coal) behaves fundamentally differently from an "Income" stock (like a utility company) during different phases of the economic cycle.
The core problem is twofold:
- Data Scarcity: Human-labeled properties are expensive and often biased.
- Static vs. Dynamic: Intrinsic properties are relatively static, while the market is hyper-dynamic. Simply "tacking on" a category label to a neural network rarely works.
Methodology: Mining the Gold Mine of Mutual Funds
The authors' key insight is that Mutual Funds are managed by professionals whose portfolios reflect their common beliefs about a stock's nature. If multiple top-tier managers hold the same group of stocks, those stocks likely share latent "Intrinsic Properties."
1. Extracting Properties via Matrix Factorization
The team constructed a matrix where rows represent fund managers and columns represent stocks. By applying Matrix Factorization (MF), they decomposed this behavior matrix into latent vectors:
- : The latent representation of Stock (its intrinsic properties).
- : The preference of fund manager .
2. The Dynamic Integration Framework
To make these static vectors work in a dynamic setting, they proposed the IMTR (Integrating Market Trend Representations) model.
- First, they identify the "Market State" by averaging the property vectors of the current top-performing stocks.
- They then use an LSTM to predict how the "Market Trend" (the market's preference for certain properties) will evolve.
- Finally, the correlation between a specific stock’s property and the predicted market trend is fed into the final prediction layer.
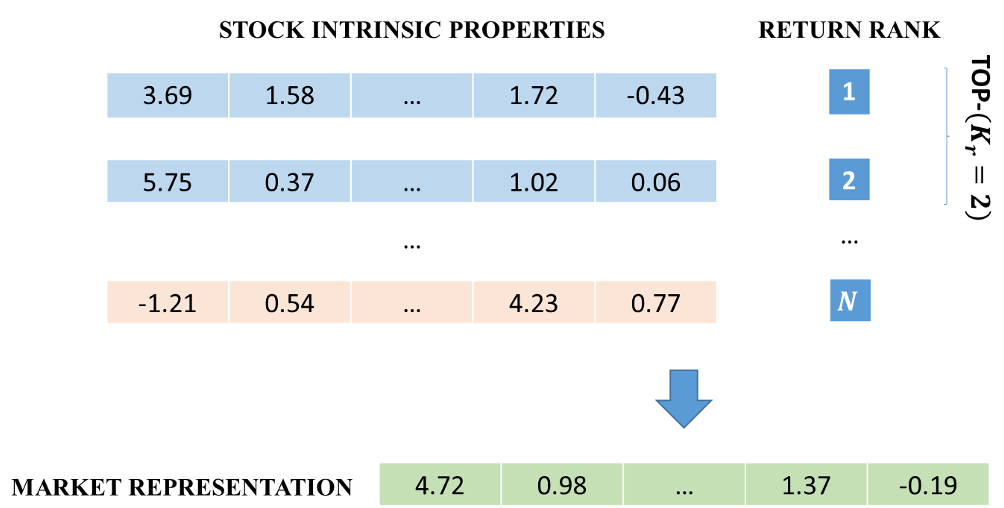 Figure 1: The architecture showing how static properties and dynamic indicators are fused through a market trend module.
Experimental Evidence
The researchers tested their model on over 2,000 stocks in the Chinese market.
Qualitative Validation: Property Clusters
The learned vectors weren't just random noise. When clustered, stocks naturally grouped into sensible sectors such as Basic Industry, Electronics, and Agriculture, proving the Matrix Factorization successfully captured real-world market logic without explicit sector labels.
Performance Gains
The proposed IMTR and IMSR models significantly outperformed standard LSTMs and even the state-of-the-art State Frequency Memory (SFM) models.
| Method | MAP@50 (2015-1) | MRR (2015-1) |
|---|---|---|
| Stock_SFM (Baseline) | 0.354 | 0.082 |
| IMTR (Proposed) | 0.372 | 0.091 |
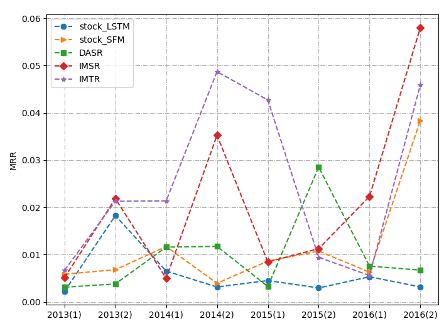 Figure 2: Performance comparison highlighting the advantage of using intrinsic properties (IMTR/IMSR) over baseline models.
Profit Simulation: The Ultimate Test
The true value of a financial paper lies in the "Back-test." In a simulated trading environment where the model picks the top 50 stocks daily, the property-aware models (IMTR/IMSR) generated substantially higher cumulative profits than the market average, particularly showing resilience during the 2015 market crash.
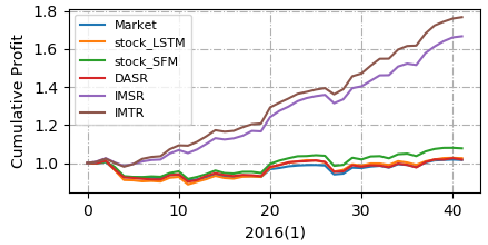 Figure 3: Cumulative profit curves showing the proposed methods outperforming standard baselines.
Critical Insight & Conclusion
The genius of this paper is not just the use of Deep Learning, but the source of the features. By treating institutional investment behavior as a supervised signal for stock properties, the authors managed to "digitize" the intuition of thousands of professional fund managers.
Limitations: The model relies on semi-annual fund reports, which are delayed. While the properties are static enough for this to work, a more real-time signals source might further enhance the "Market State" module.
Final Takeaway: For AI to beat the market, it cannot just look at price charts; it must understand the "identity" of the assets it trades.