
Investment Behaviors Can Tell What's Inside: Distilling Stock Intrinsic Properties from Fund Portfolios
Investment Behaviors Can Tell What Inside: Exploring Stock Intrinsic Properties for Stock Trend Prediction
This paper introduces a novel framework for stock trend prediction by extracting latent stock intrinsic properties from mutual fund portfolio data using Matrix Factorization. By integrating these static properties with dynamic market state modeling via an RNN/SFM architecture, the authors achieve superior ranking performance in the Chinese stock market.
TL;DR
While most AI models for stock prediction focus on "what" the price is doing, they often miss "why" certain stocks behave differently under the same market conditions. This paper from KDD '19 proposes a shift: using the investment behaviors of professional fund managers to extract latent intrinsic properties of stocks. By combining these static properties with a dynamic Market Trend model, the authors achieve a state-of-the-art ranking system that significantly boosts trading profits compared to standard RNN/LSTM approaches.
Problem & Motivation: The Missing "Inductive Bias" in Quantitative Trading
Experienced human investors don't just look at charts; they categorize stocks. A "cyclical" stock is traded differently than an "income" stock. However, deep learning models usually treat every stock as an anonymous sequence of price/volume data.
The authors identify two major challenges:
- Representation: How do we define and quantify "intrinsic properties" (Value, Growth, Volatility) when those definitions are often abstract or inconsistent?
- Dynamics: How can we use static properties (which don't change daily) to help make dynamic daily predictions?
The "Aha!" moment comes from mutual fund portfolios. Fund managers are professionals with specific styles (aggressive vs. conservative). If multiple managers group the same stocks together, those stocks likely share an intrinsic property. This collective wisdom is a "gold mine" for feature engineering.
Methodology: From Matrix Factorization to Market State Modeling
1. Extracting Inherent Properties
The authors construct an investment matrix where rows are fund managers and columns are stocks. Using Matrix Factorization (MF), they decompose this into:
- Stock Latent Vectors (): Representing the intrinsic properties.
- Manager Preference Vectors (): Representing the managers' "taste."
This allows the model to learn a multi-dimensional embedding for every stock that captures its sector, risk profile, and growth potential without manual labeling.
2. The Dynamic Integration Framework
Simply concatenating these static vectors to an RNN doesn't work well because the market's "appetite" for different properties shifts over time. The authors propose the IMTR (Integrating Market Trend Representations) architecture:
- Market State (): Calculated by averaging the property vectors () of the top-performing stocks of the day. This represents what "the market currently likes."
- Market Trend (): An LSTM models the sequence of these market states to predict what properties will be favored tomorrow.
- Correlation (): The model calculates the dot product between an individual stock's properties and the predicted market trend.
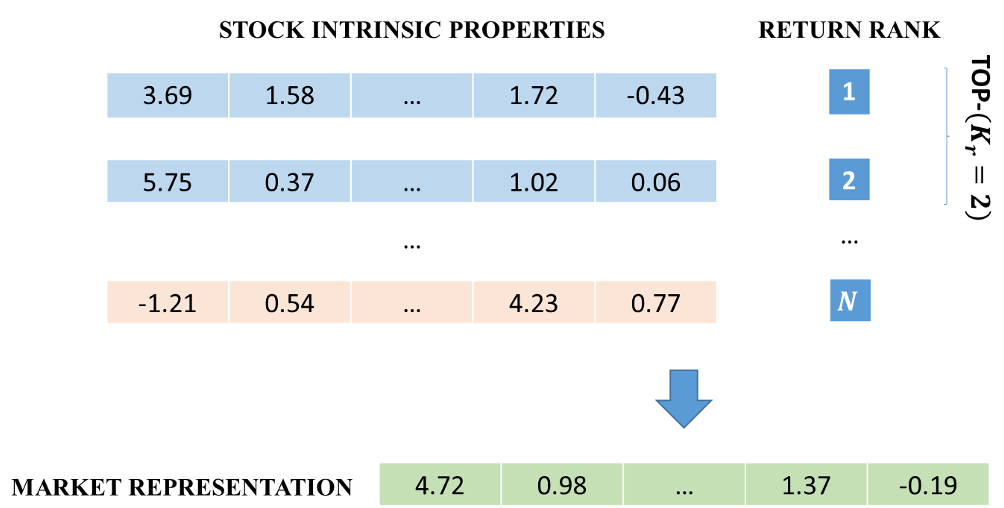 Figure 1: The architecture showing how static properties interact with dynamic market representations to produce a final ranking.
Experiments & Results: Proving the Value of "Hidden" Knowledge
The authors tested their approach on the Chinese stock market (2013-2016).
Qualitative Analysis: Do the Vectors Make Sense?
Using Affinity Propagation clustering on the learned vectors, the authors found that the model automatically grouped stocks into logical categories (e.g., Basic Industry vs. Electronics) without ever being told the industry sectors. This validates that the MF approach successfully "unmasked" the real-world properties of the stocks.
Quantitative Performance
The models IMSR and IMTR consistently outperformed:
- Stock_LSTM: Standard sequential modeling.
- DASR: Directly appending properties (proving that dynamic integration is necessary).
- Stock_SFM: The previous SOTA that used multi-frequency decomposition.
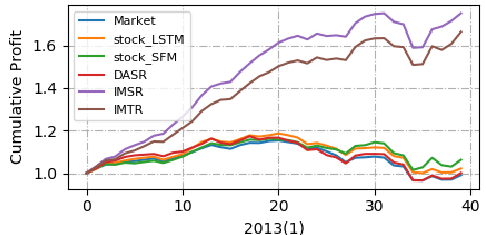 Figure 2: MAP@50 comparison across different time periods. Note the consistent edge of IMTR.
In back-testing simulations, the IMTR strategy achieved superior cumulative profits. Crucially, during the market "bubble popping" of late 2015, the intrinsic properties helped the model select stocks that were more resilient to the crash.
Critical Insight & Conclusion
The core takeaway is that professional investment behavior is a high-signal proxy for stock fundamentals. While financial reports are noisy and late, the actions of the "smart money" provide a real-time, distilled representation of a stock's DNA.
Limitations:
- The model updates stock representations every six months (matching report cycles). In high-frequency environments, this might be too slow.
- If fund managers are collectively wrong (market bubbles), the learned embeddings might reflect biased sentiments rather than "intrinsic" truth.
Future Outlook: This methodology opens the door for using other behavioral data——such as social media sentiment or supply chain relationships——to build richer, multi-modal embeddings for financial assets.