
Beyond the Crowd: Mining High-Quality Investment Opinions in Social Networks
Investment recommendation by discovering high-quality opinions in investor based social networks
This paper proposes a framework for investment recommendation by discovering high-quality opinions in Investor-Based Social Networks (IBSNs) like StockTwits. It introduces a non-negative least squares (NNLS) model to predict opinion quality and utilizes these predictions for both high-quality opinion retrieval and quality-sensitive portfolio recommendation.
TL;DR
Social media platforms like StockTwits are goldmines for investor sentiment, but they are also filled with "noise"—low-quality or misleading advice. This paper introduces a sophisticated methodology to predict the quality of individual investment opinions using Author, Content, and Stock-level features. By weighting social sentiment with these predicted quality scores, the authors demonstrate a significant boost in both opinion recommendation accuracy and portfolio profitability.
Problem & Motivation: The Noise in the Crowd
The prevailing "Wisdom of the Crowd" theory suggests that aggregating thousands of sentiments will eventually cancel out errors and reveal the truth. However, in financial markets, this "wisdom" is often drowned out by:
- Malicious Actors: Users intentionally posting misleading information.
- Noisy Non-Experts: Retail investors who lack technical or fundamental backing.
- Stock-Specific Volatility: Some stocks are fundamentally harder to predict regardless of sentiment.
Previous works attempts to mitigate this by identifying "experts." But an expert on Tech stocks might fail at predicting Bio-tech, and even experts have "off" days. This paper's core insight is that opinion quality is a multi-faceted variable that depends not just on the author's history, but on the specific words used and the predictability of the stock in question.
Methodology: The Three Levels of Quality
The authors break down opinion quality into eight distinct factors across three hierarchical levels:
1. Author Level (The "Who")
Beyond just looking at past correctness (A_CP) and average quality (A_AQ), the model looks at social popularity (A_SP) and investment energy (A_IE)—how much time they spend posting, which signals effort and research.
2. Content Level (The "What")
This is a major departure from prior work. The authors calculate a "Correctness Score" for individual words. If an opinion contains words traditionally associated with successful historical predictions, its quality score increases.
3. Stock Level (The "Where")
Not all stocks are created equal. Some stocks are heavily manipulated or inherently volatile. The model tracks the historical "predictability" of stocks mentioned in the opinion.
The Prediction Model: Non-Negative Least Squares (NNLS)
To combine these factors, the authors use a linear model:
Q(o) = w · x_o + b
Crucially, they apply a non-negativity constraint (w ≥ 0). Why? Because intuitively, factors like "Author Correctness" should never negatively correlate with "Opinion Quality." NNLS ensures the model remains physically consistent with financial intuition.

Experiments & Results
The researchers tested their approach on a massive dataset of 2.32 million StockTwits messages and historical price data from Yahoo! Finance.
Opinion Recommendation
When tasked with finding the "best" opinions for users to read, the proposed PredQual(NNLS) method outperformed simple linear regression and expert-based filtering. This proves that the combination of features is more powerful than any single metric (like follower count or past performance).
Portfolio Profitability
The most striking result came from Quality-Sensitive Sentiment Aggregation (QS-Aggr). Instead of just counting bullish vs. bearish votes, they weighted each vote by its predicted quality.
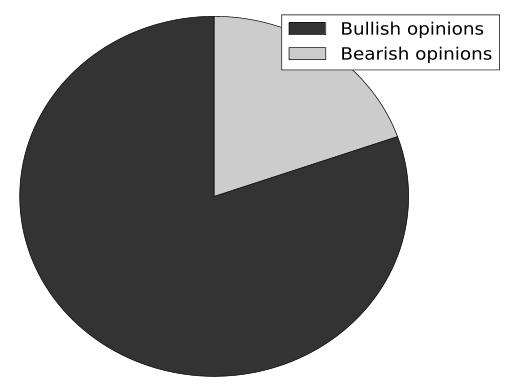 Figure: The reliability test across eight hypotheses confirms that high-quality opinions show significantly higher factor values across all categories.
As the data shows, the QS-Aggr method produced portfolios with higher returns than "Trad-Aggr" (Traditional Aggregation), proving that filtering for quality directly translates to financial alpha.
Critical Analysis & Conclusion
Takeaways
- Context Matters: A tweet's value isn't just about the author's reputation; the specific stock and the professional content of the message are vital predictors of success.
- Robustness: By using NNLS, the model avoids overfitting to weird statistical anomalies that might suggest a "bad" factor is actually "good."
Limitations & Future Work
The model is currently non-personalized; it recommends the "best" opinions to everyone. Future extensions could align these recommendations with an individual user's risk profile or existing portfolio. Furthermore, moving beyond linear models to Graph Neural Networks (GNNs) could capture how opinions propagate and gain "social proof" in real-time.
This work stands as a robust bridge between social media mining and quantitative finance, reminding us that in the world of data, quality beats quantity every time.