
More Than Topology: Bridging the Gap Between Graph Structure and Node Attributes
More than topology: Joint topology and attribute sampling and generation of social network graphs
The paper introduces a novel graph sampling and generation framework aimed at capturing the joint distribution of topology (node degree) and user attributes (e.g., age, interests) in social networks. The core method extends the 2.5K-graph approach by utilizing a joint degree attribute distribution (JDAD) and a new similarity measure, NetSimileAtt, to produce synthetic graphs that mirror the homophily and structural properties of real-world Online Social Networks (OSNs).
TL;DR
Most graph models treat "who connects to whom" as a purely structural math problem. However, in the real world, we connect with people because of who they are (attributes). This paper introduces a framework to sample and generate social networks that jointly preserve both the "skeleton" (topology) and the "flesh" (attributes) of the graph, enabling more realistic simulations for traffic management and social behavior analysis.
The Motivation: Why Structure Isn't Enough
If you only look at the number of friends a person has (degree), you miss the fact that students often connect with others in their same major or dormitory—a phenomenon known as homophily.
Previous SOTA methods like the 2.5K-graph model were excellent at replicating node degrees and clustering, but they were "blind" to attributes. Conversely, attribute models often ignored complex structural features like triangles (clustering). The authors argue that to truly understand or simulate an Online Social Network (OSN), we must capture the Joint Degree Attribute Distribution (JDAD).
Methodology: Capturing the "Hidden" Dependencies
The authors build a pipeline that moves from sampling to estimation, and finally to generation.
1. Joint Sampling (The Input)
The process starts with a Re-Weighted Random Walk (RWRW). While random walks naturally over-sample popular (high-degree) nodes, the authors use the Hansen-Hurwitz estimator to correct this bias. Crucially, they record both the degree and the attribute (e.g., age, location) of each visited node to create a 2D probability map.
2. The JDAD Matrix
The heart of the paper is the Joint Degree Attribute Distribution (JDAD). Instead of just asking "How many degree-10 nodes connect to degree-20 nodes?", it asks: "How many 30-year-old degree-10 nodes connect to 25-year-old degree-20 nodes?"
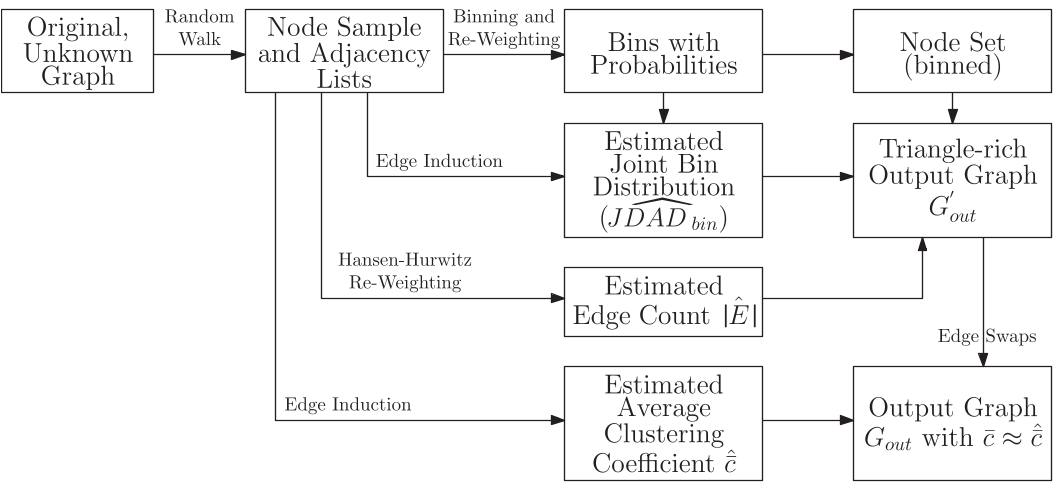 Above: The workflow from random walk sampling to the generation of synthetic graphs via JDAD and clustering estimates.
3. Synthetic Generation
The generation doesn't just "connect the dots." It follows a three-step dance:
- Node Creation: Create a node set matching the sampled attribute/degree distribution.
- Greedy Triangulation: Add edges in a coordinate-based system to maximize the clustering coefficient.
- MCMC Rewiring: Perform edge swaps that keep the JDAD constant but nudge the global clustering coefficient (cc) toward the target value estimated from the sample.
Experiments & Results
The authors tested their approach against real-world data from the Pokec network (1.6 million nodes) and Facebook university subgraphs.
Key Finding: Absolute Sample Size Matters
A fascinating insight from the study is that for massive graphs, you don't need to sample a certain percentage of the network; you just need a certain absolute number of nodes. For the 1.6M-node Pokec graph, a tiny 2% sample was enough to yield a Kolmogorov-Smirnov distance (D) below 0.01, indicating an nearly identical distribution.
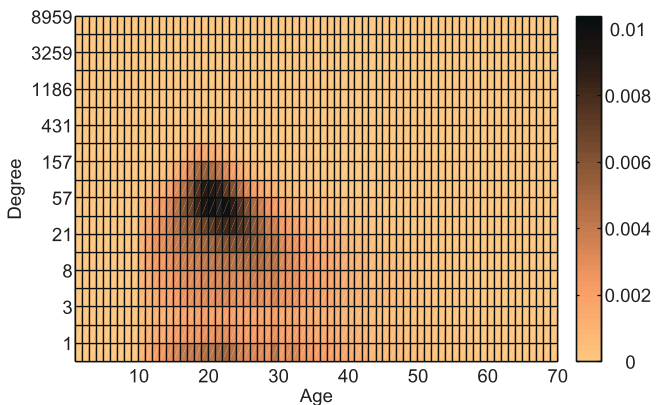 Above: Joint distribution of age and node degree in the Pokec graph—showing how accurately the different sampling methods (UNI, BFS, MHRW, RWRW) capture the ground truth.
Introducing NetSimileAtt
To prove their graphs were realistic, the authors extended the "NetSimile" measure to NetSimileAtt. This metric looks at:
- Mean node/neighbor weights based on attribute similarity.
- Egonet homophily (how similar you are to your local cluster).
The results showed that while the 2.5K model was slightly better at pure topology, it failed miserably at attribute distribution. The proposed model, however, succeeded at both.
Critical Analysis & Takeaways
This work is a significant step toward socially-aware traffic management. For an ISP, knowing that a certain cluster of users shares an interest in a specific type of media allows for better edge caching and prefetching.
Limitations:
- Scalability of Generation: While sampling is fast, the current MCMC-based generation is computationally expensive for graphs with millions of nodes.
- Fixed Size: The model currently generates a graph of the same size as the input; it cannot yet "grow" a graph from 10k nodes to 100k nodes while maintaining properties.
Future Outlook: The next frontier is extending this to dynamic graphs. Social networks aren't static; they evolve. Being able to sample a "snapshot" and generate a "future" version of that graph with evolving attributes would be the holy grail of OSN modeling.
Conclusion
"More than Topology" reminds us that nodes in a social network are more than just points on a map; they are entities with identities. By capturing the JDAD, this paper provides a roadmap for building synthetic environments that truly feel "human."