
Strategic Segmentation of Health Insurance Populations: A Hybrid MCA and K-means Approach
Clustering of the population benefiting from health insurance using K-means
2019-10-02
Summary
Problem
Method
Results
Takeaways
Abstract
This paper proposes a clustering framework to segment health insurance beneficiaries using a combination of Multiple Correspondence Analysis (MCA) and the K-means algorithm. Applied to a massive dataset of over 630,000 individuals from a Moroccan pension fund, the study successfully identifies three distinct demographic clusters to assist decision-makers in monitoring insurance coverage and health risks.
## TL;DR
Understanding the demographic structure of an insured population is critical for fiscal sustainability in healthcare. This paper presents a robust methodology using **Multiple Correspondence Analysis (MCA)** and **K-means** to segment over 630,000 Moroccan insurance beneficiaries into three distinct, actionable clusters: Children, Pensioners, and the Active Population. The approach yields a significant performance boost over traditional methods like KNN, offering a data-driven roadmap for social security officials.
## The Challenge: Categorical Complexity in Big Data
Decision-makers in the health insurance sector face a "curse of dimensionality" when dealing with population data. Most meaningful attributes—such as family relationship, insurance type, and gender—are **categorical**.
Standard clustering algorithms like K-means are designed for Euclidean space (continuous numbers). Forcing categorical data into these models often leads to poor "centroids" and meaningless groups. The authors identify this gap, noting that to monitor insurance coverage effectively, we need a method that respects the categorical nature of the data while leveraging the efficiency of partitional clustering.
## Methodology: The MCA + K-means Pipeline
The authors propose a sophisticated unsupervised learning pipeline to bridge the gap between categorical traits and mathematical clustering.
### 1. Dimensionality Reduction via MCA
Multiple Correspondence Analysis acts as the "PCA for categorical data." It transforms discrete categories into factorial coordinates. In this study, the authors transformed qualitative variables into two dimensions that captured **62% of the total inertia** (information variance).
### 2. The Partitional Logic: K-means
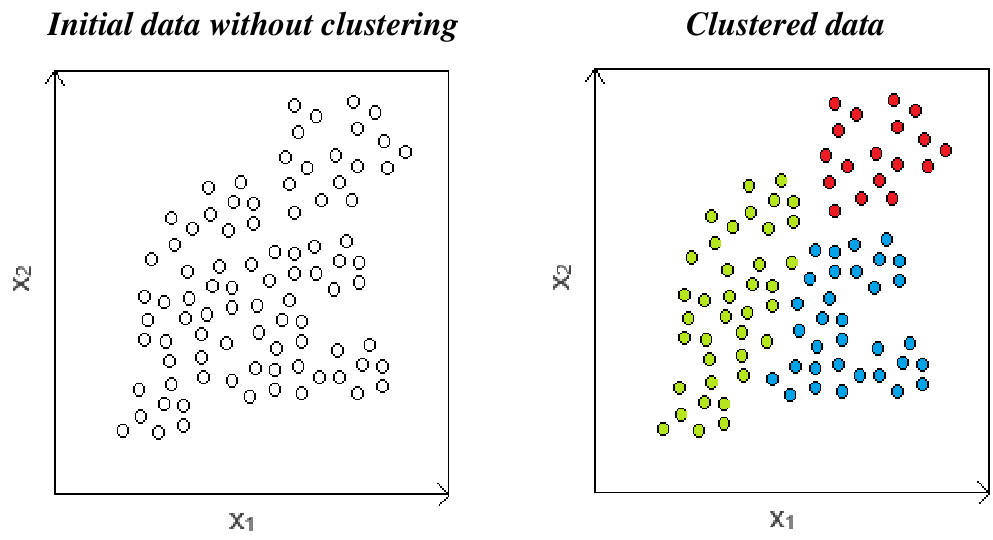
Once the data was projected into a quantitative 2D space, the K-means algorithm was applied. The objective was to minimize the **Within-Cluster Sum of Squares (WCSS)**:
$$\sum_ {k = 1} ^ {K} \sum_ {x _ {i} \in C _ {\kappa}} \| x _ {i} - \mu_ {k} \| ^ {2}$$
### 3. Finding the "Elbow"
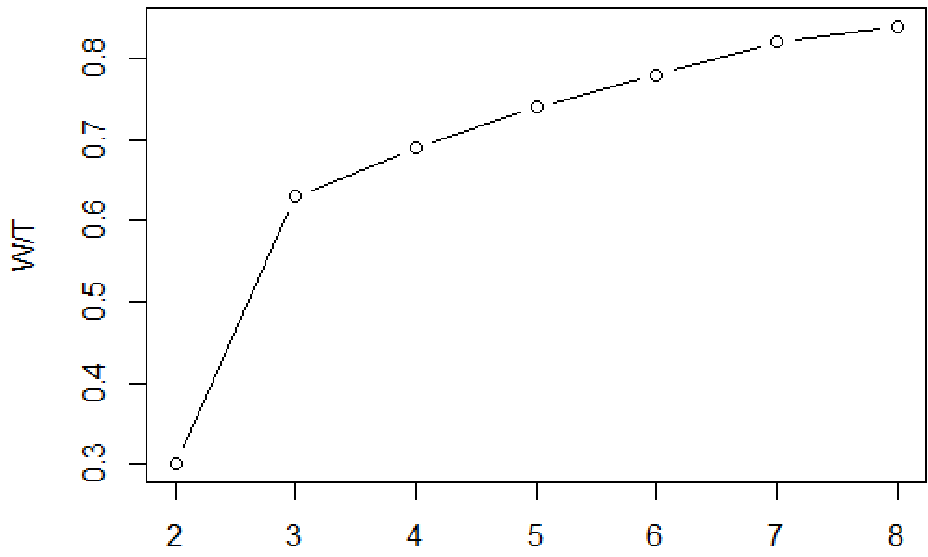
To ensure the number of clusters wasn't arbitrary, the authors used the **Elbow Graph**. By plotting the ratio of within-cluster dispersion to total inertia (W/T), they identified **K=3** as the point where adding another cluster provided diminishing returns in terms of variance explained.
## Performance and Validation
The results were validated using the **Silhouette Coefficient**, which measures how similar an object is to its own cluster compared to other clusters.
| Cluster | Population Segment | K-means Silhouette | KNN Silhouette |
| :--- | :--- | :--- | :--- |
| Cluster 1 | Children | **0.75** | 0.55 |
| Cluster 2 | Pensioners | **0.83** | 0.64 |
| Cluster 3 | Active Population | **0.69** | 0.43 |
The K-means approach consistently outperformed the K-Nearest Neighbors (KNN) baseline across all segments, indicating a much tighter and more distinct grouping of the population.
## Critical Insight: Why This Matters
The importance of this study lies in its **empirical interpretability**. The clusters didn't just meet mathematical criteria; they mirrored real-world demographic structures:
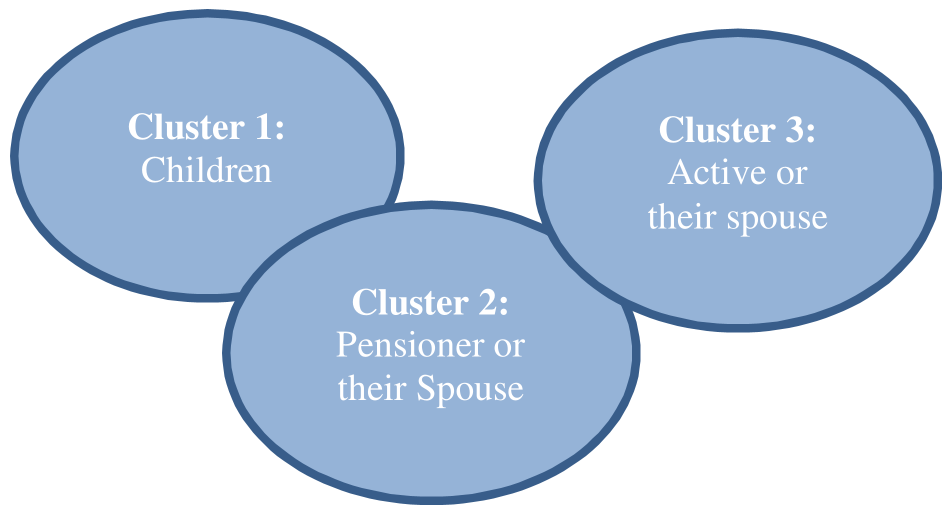
- **Cluster 1**: Dominated by children (100% relationship) of active workers.
- **Cluster 2**: Primarily retirees (95% pensioners) and their spouses.
- **Cluster 3**: The workforce (active insured individuals and spouses).
This clear segmentation allows insurance providers to model **refund risks** differently for each group. For instance, the medical needs (and financial risks) of a pensioner cluster are vastly different from those of the children's cluster.
## Future Outlook
While highly effective, the study primarily relies on static demographic data. The authors suggest that future research should integrate **refund modeling**—linking these clusters to actual expenditure data to predict the financial impact of different illness risks. As social security systems become increasingly data-poor and cost-heavy, such "intelligent monitoring" systems will be the backbone of sustainable public health policy.