
kNN CF as a Temporal Social Network: Beyond Mean Error
kNN CF: A Temporal Social Network
This paper introduces a graph-theoretic perspective on k-Nearest Neighbor Collaborative Filtering (kNN CF) by modeling it as a temporal, constrained implicit social network. Using the MovieLens datasets, the authors evaluate how similarity measures and neighborhood sizes influence the evolution of user relationships and the emergent "small-world" structural properties of the recommendation community.
TL;DR
Recommender systems are more than just prediction engines; they are architects of implicit social structures. This paper shifts the focus from "accuracy at all costs" to the topological evolution of kNN Collaborative Filtering. By viewing users as nodes in a dynamic graph, the authors discover that recommendation algorithms create "small-world" networks dominated by a few "power users" who hold the keys to the system's predictive performance.
The "Black Box" of Accuracy
The race for the Netflix Prize and SOTA mean-error scores often masks what is actually happening to the user community. Most researchers treat the user-item matrix as a static snapshot, ignoring that:
- Similarity is volatile: As users add ratings, their "closest" neighbors might shift erratically.
- Structural Bias: The kNN algorithm inherently favors certain users, making their opinions the "gold standard" for the entire community.
Methodology: The Graph Perspective
The authors model kNN CF as a weighted, directed graph. If user has user in their top- neighbors, an edge exists. This allows them to apply Social Network Analysis (SNA) to understand the "physics" of recommendation.
1. The Three Faces of Similarity
The paper provides a brilliant taxonomy of similarity measures based on their temporal stability (see Figure 4 in the paper):
- Incremental (COR, wPCC): Relationships evolve smoothly; the similarity converges as more data arrives.
- Corrective (VS): Similarity "jumps" to near-perfection with minimal data but degrades as more info is added.
- Near-Random (PCC): Shows extreme volatility, where adding a single rating can cause a massive, unpredictable swing in neighbor ranking.
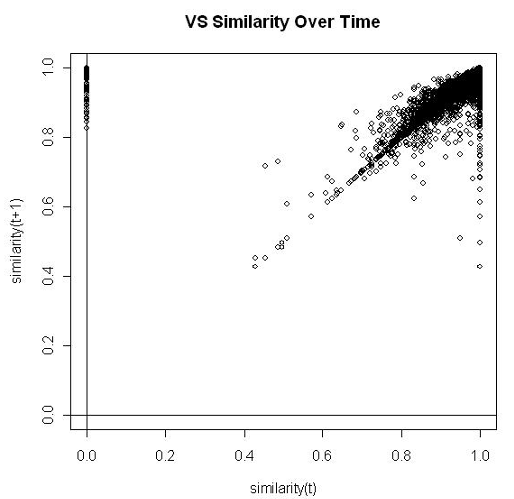 Figure: The variance from the diagonal (y=x) illustrates the stability of different similarity measures over time.
2. Emergent Small-Worlds
Despite being an implicit network, kNN graphs exhibit small-world characteristics (average path lengths of 1.4 to 2.9 hops) and a power-law in-degree distribution. This means most users are never picked as neighbors, while a select few "Power Users" are picked by almost everyone.
Key Insights from Experiments
The Power of Power Users
The authors performed a fascinating ablation study: what happens if we remove the most influential users?
- Total Reliance: Removing power users significantly degrades coverage and accuracy.
- Extreme Pruning: Interestingly, for some users, a neighborhood of ONLY 10 power users provides better accuracy than their actual neighbors, because those 10 users hold access to over 50% of the dataset's information.
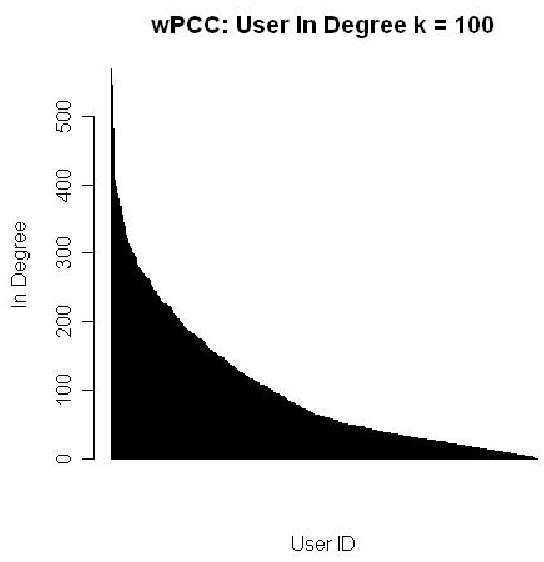 Figure: The power-law distribution showing that a tiny fraction of users act as the primary recommenders for the entire system.
Data Utilization
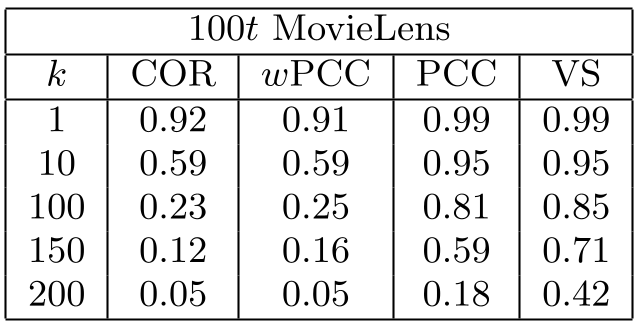
Not all algorithms use your data equally. When is low, over 90% of the training ratings might never be used in a prediction. However, "incremental" measures like COR and wPCC utilize the training set much more efficiently than the VS measure.
Critical Analysis & Future Outlook
This work highlights a profound Inductive Bias in kNN: we are not just matching users; we are creating a hierarchy.
- Cold-Start Solution: Instead of struggling to find neighbors for a new user, we can temporarily link them to "Power Users" who act as the "backbone" of the network.
- Scalability: If the system's performance is driven by a small subset of nodes, we can optimize computation by prioritizing these influential users.
- Limitation: The study is limited to user-user kNN; how these properties shift in item-item CF or the latent spaces of Matrix Factorization remains a compelling question for modern research.
Takeaway: To build a better recommender, don't just look at the error labels—look at the graph you are weaving. The stability and connectivity of your user "social network" are the true predictors of long-term success.