
Know Thy Neighbor: Why the Way You Map Social Contacts Is the Secret to DTN Routing
Know Thy Neighbor: Towards Optimal Mapping of Contacts to Social Graphs for DTN Routing
The paper introduces an online algorithm that optimizes the "contact aggregation" process in Delay Tolerant Networks (DTNs). By using spectral graph theory and unsupervised learning (cluster modularity), the method dynamically identifies the optimal density for social graphs, leading to routing performance improvements of up to 4x compared to traditional time-based aggregation.
TL;DR
In Delay Tolerant Networks (DTNs), routing is a game of predicting the future based on the past. This paper argues that the sophistication of your routing algorithm matters less than how you aggregate past contacts into a social graph. The authors introduce a self-tuning algorithm using spectral graph theory that identifies the "Goldilocks zone" of graph density, boosting delivery rates by up to 400%.
The "Fog of War" in Intermittent Networks
In DTNs, nodes (phones, sensors, vehicles) rarely have a stable end-to-end path. They must "store-carry-forward" messages. Modern protocols like SimBet and BubbleRap use Complex Network Analysis (CNA) to solve this—calculating which nodes are "central" (bridges between groups) or "similar" to the destination.
However, there is a fundamental flaw in how these protocols build their maps. They usually aggregate contacts over a fixed time window (e.g., "all contacts in the last 6 hours").
- Too short? The graph is empty; you can't see the social structure.
- Too long? After a few days, everyone has "met" everyone else incidentally. The social graph becomes a "complete graph" (a messy hairball), and centrality metrics become useless noise.
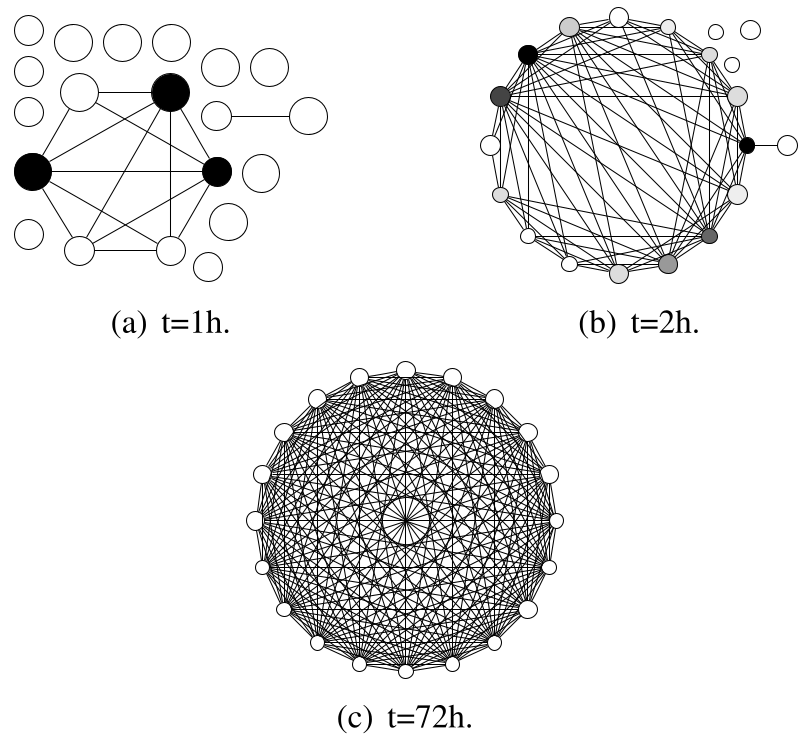 Fig 1: As time progresses (1h to 72h), the social graph at ETH shifts from sparse to overly dense, washing out the distinctiveness of "central" nodes.
The Insight: Density Matters More Than Sophistication
The authors discovered that the performance of these protocols is extremely sensitive to graph density (the ratio of existing edges to all possible edges).
By simulating synthetic "Caveman" and "Small-World" mobility models, they found that there is a peak operating point. If you include too many "random" contacts (those familiar strangers you pass once at a bus stop), you drown out the "regular" contacts (your actual colleagues or friends) who are predictable relays.
Methodology: Tuning the Graph via Spectral Theory
How does a node, acting alone, know if its map is "just right"? The paper proposes an unsupervised learning approach.
1. The Similarity Histogram
A node calculates its similarity with everyone it meets. If the graph density is optimal, there should be two clear "clusters" of values:
- High Similarity: Your social "community" neighbors.
- Low Similarity: Random incidental encounters.
2. Spectral Connectivity & Modularity
To find the density that makes these two groups most distinct, the algorithm uses two mathematical tools:
- Algebraic Connectivity (): Based on the Laplacian of the similarity matrix. Minimizing the second smallest eigenvalue helps identifies when a graph is most ready to be partitioned into distinct clusters.
- Modularity Function (Q): Measures the strength of the division of a network into modules. A higher means a better-defined community structure.
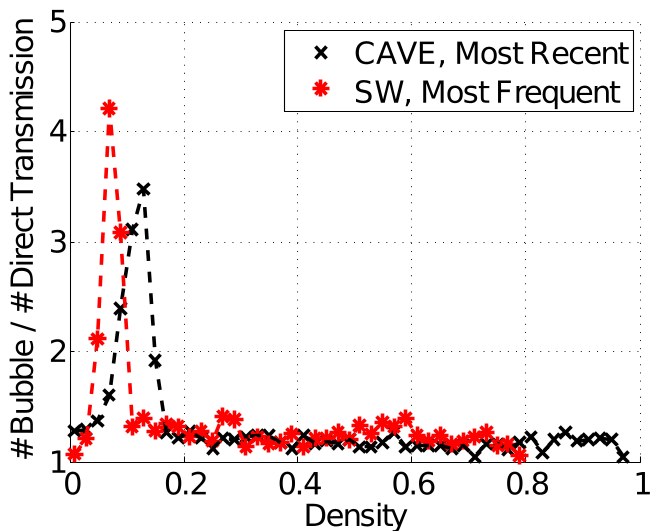 Fig 2: Performance peaks (Delivery Ratio) occur at specific, narrow density levels (e.g., 0.1 for most models).
Experimental Results: The 4x Performance Leap
The results are striking. By using the Online Optimal Density Tracking Algorithm, nodes can locally adjust their aggregation windows. In Caveman and Small-World scenarios, the delivery ratio improved by a factor of 4 compared to "Direct Transmission" and significantly outperformed the naive "Growing Window" approach, which eventually fails as the graph becomes too dense.
| Protocol | MIT Trace | ETH Trace | Caveman Model |
|---|---|---|---|
| SimBet (Online) | 1.8x | 1.5x | 3.0x |
| BubbleRap (Online) | 2.1x | 1.5x | 3.6x |
Note: Table values represent the "Performance Factor" relative to Direct Transmission baseline.
Critical Insight & Future Outlook
This work shifts the focus from who to forward to, to how we define the relationships in the first place. The "Social" in social routing is only as good as the filtering mechanism that removes random noise from predictable human patterns.
Limitations: The spectral calculation (eigenvalue decomposition) can be computationally heavy for low-power IoT devices. However, the authors suggest the Q Function as a lighter alternative that yields similar results.
Future Directions: Applying these spectral methods to weighted graphs (where edges have varying strengths) could further refine routing in even more chaotic urban environments.