
Measuring Leadership: The Computational Complexity of Power in Social Networks
KNOWLEDGE‐BASED SYSTEMS
The paper introduces novel collective decision-making models (oblivious and non-oblivious influence models) based on influence spread within social networks using the linear threshold model. It characterizes the generalized opinion leader–follower (gOLF) model and formally links satisfaction and power measures to the Banzhaf value and Rae index in game theory.
TL;DR
In social networks, who truly holds the power—the vocal "opinion leaders" or the "mediators" who facilitate communication? This paper provides a rigorous mathematical framework to answer this by introducing Oblivious and Non-Oblivious Influence Models. While calculating a person's "satisfaction" (how often the group agrees with them) or "power" (how often they are the tie-breaker) is generally #P-hard (computationally intractable), the authors identify specific hierarchical and star-shaped network structures where these values can be computed efficiently.
Background: Moving Beyond "Followers" and "Leaders"
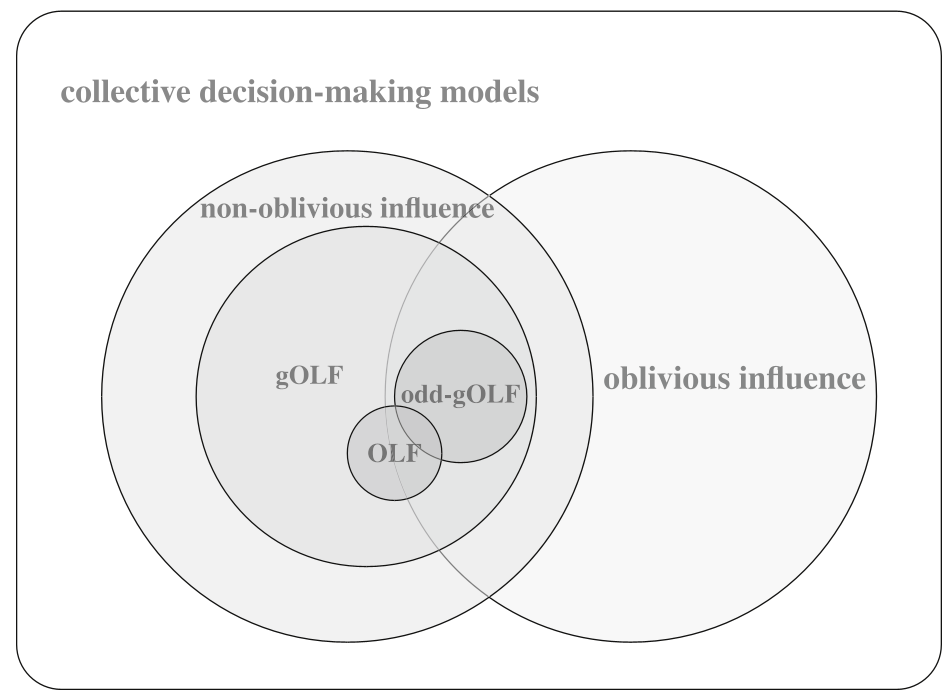
Sociology has long used the "two-step flow of communication" theory (leaders influence followers). In 2011, the Opinion Leader-Follower (OLF) model formalized this. However, real life isn't just a bipartite graph. We have mediators, independent actors, and complex voting quotas.
The authors of this paper ask: If we change the network to a general graph and the voting rule to any quota, how hard is it to calculate if someone is actually influential?
The Methodology: Game Theory Meets Social Influence
The paper defines two core models based on the Linear Threshold Model:
- Oblivious Influence Model: Non-players (followers) are assumed to have a negative initial bias; their final vote depends solely on being influenced.
- Non-Oblivious Influence Model: Every actor has an initial inclination, and their final decision is a tug-of-war between their original choice and the pressure from their neighbors.
The Mathematical Bridge
One of the most profound insights of this work is linking these social measures to classical game theory:
- Satisfaction (Sat) = Rae Index (The probability that a voter's side wins).
- Power (Pow) = 2 × Banzhaf Value (The probability that a voter's swing is decisive).
This connection means that decades of research into power indices can now be applied directly to social influence analysis.
The Core Hardness: Why Power is Hard to Calculate
The authors prove that calculating power is #P-hard. They do this by reducing the #2/3-Vertex Cover problem (counting specific subsets in a graph) to an "Expansion" problem in their influence model.
Even in a simple two-layered bipartite graph—where leaders only talk to followers—determining who is "powerful" is as difficult as the hardest counting problems in computer science.
Finding the "Sweet Spots": Tractable Social Structures
If general calculation is hard, where can we succeed? The authors identify two "tractable" families:
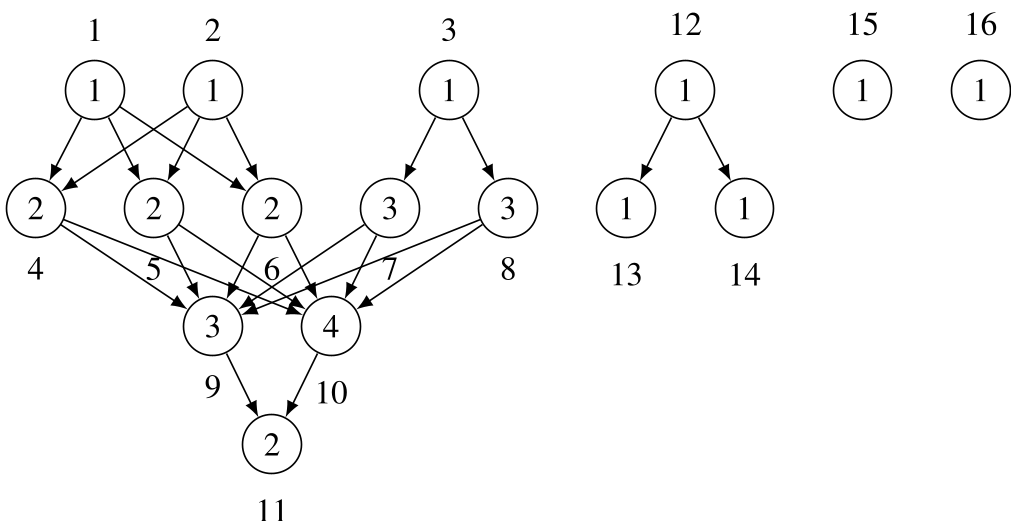
1. Strong Hierarchical Influence Graphs
In these models, society is organized into strict layers. Leaders influence mediators, who influence followers. Because the influence is "all-to-all" between layers, the authors provide a dynamic programming algorithm that calculates satisfaction in polynomial time.
2. Star Influence Graphs
These model a central mediator (a "hub") who has bidirectional communication with certain actors. The paper proves that despite the feedback loops, we can still precisely calculate the influence of the hub and the periphery.
Experimental Insight: Not All Leaders are Equal
Through their algorithms, the authors demonstrate a critical "Aha!" moment: In OLF models, even if the graph topology marks two people as "leaders," their actual satisfaction and power measures can differ wildly based on whom they influence.
 Snippet showing how different actors (1-7) in a simple bipartite graph yield vastly different Satisfaction and Power scores.
Critical Analysis & Conclusion
The value of this paper lies in its unification. It bridges the gap between sociology (influence spread) and cooperative game theory (simple games).
Takeaway: If you are designing a digital voting system or a corporate hierarchy, remember that calculating the "fairness" or "power balance" of that system is likely impossible for large, messy networks. However, by enforcing hierarchical or star-like structures, you gain the ability to mathematically audit the influence of every participant.
Limitations: The paper mostly assumes a "Yes/No" binary decision. Future work needs to address multi-choice dynamics and continuous opinion scales, which are more common in modern social media ecosystems.