
Consensus in Social Networks: A Visual Interaction Model Driven by Trust Propagation
KNOWLEDGE‐BASED SYSTEMS
2024-01-10
Summary
Problem
Method
Results
Takeaways
Abstract
The paper proposes a novel visual interaction consensus model for Social Network Group Decision Making (SN-GDM) that integrates trust propagation, a trust-based recommendation mechanism, and a visual adoption interface. By utilizing Einstein t-norms and t-conorms for dual trust propagation, the model achieves SOTA flexibility in helping experts balance group consensus and individual independence.
## TL;DR
Achieving consensus in a group isn't just about averaging numbers; it's about trust and the willingness to compromise. This paper introduces a framework for **Social Network Group Decision Making (SN-GDM)** that uses a **dual trust propagation** mechanism to fill in missing trust links and a **visual adoption interface** that lets experts see the results of their potential compromises before they make them.
## Background & Motivation: Why Trust Matters
In traditional Group Decision Making (GDM), we often assume experts are independent units. In reality, they are part of a social network. If I don't trust the person giving me advice, I am unlikely to change my opinion.
Current SOTA models face two core failures:
1. **Mathematical Intuition**: Previous trust propagation models often allow trust to grow or distrust to fade inappropriately over long chains.
2. **Human Autonomy**: Most systems "push" recommendations at inconsistent experts, ignoring their desire to remain independent or minimize the "cost" of changing their minds.
## Methodology: The Dual Trust & Visual Feedback Loop
### 1. Dual Trust Propagation (The Einstein Approach)
To solve the propagation issue, the authors use **Einstein t-norms and t-conorms**. The intuition is simple: as trust moves through a "Trusted Third Partner" (TTP), the trust value should decrease, while the distrust should naturally increase due to the uncertainty of the chain.
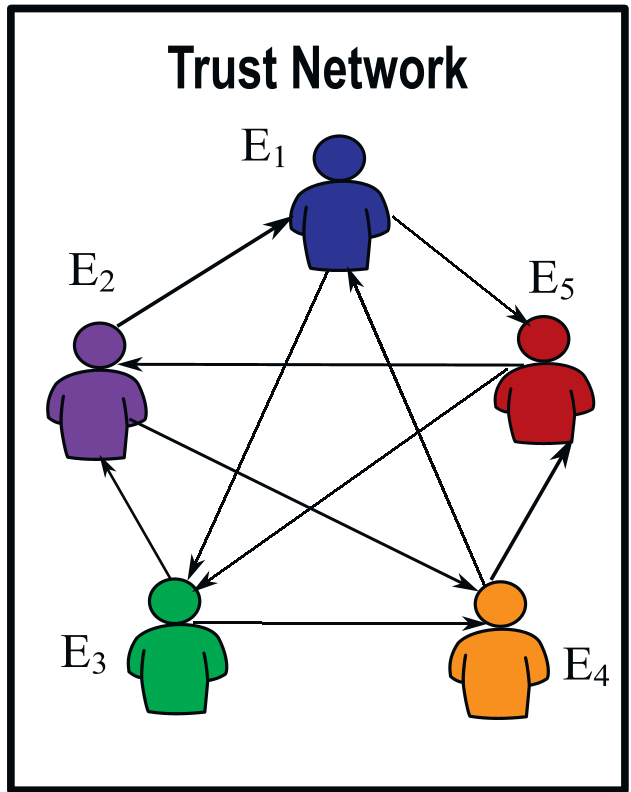
*Figure 1: Illustration of a social network where trust needs to be propagated across indirect paths.*
### 2. Identifying the Gap
The system calculates consensus at three hierarchical levels:
- **Element level**: Comparison of specific alternative-criterion pairs.
- **Alternative level**: Overall agreement on a single choice.
- **Decision Matrix level**: The expert's alignment with the entire group.
### 3. The Visual Adoption Mechanism
This is the most innovative part of the workflow. Instead of a "take it or leave it" advice, experts are given a **feedback parameter ($\delta$)**.
- If $\delta=0$, the expert keeps their original opinion.
- If $\delta=1$, they fully adopt the group's recommendation.
Using a visual interface, the expert can slide $\delta$ and see exactly how much their "Consensus Index" will improve. This allows for a **negotiated balance** between group harmony and personal independence.
*Figure 2: The full workflow from trust propagation to visual consensus achievement.*
## Experiments: Putting Theory into Practice
In a numerical example involving a company selecting a cloud service provider, the model identified Expert 4 ($e_4$) as a "bottleneck" to group consensus.
Initially, the group consensus was **0.860**, below the target threshold of **0.9**. By using the visual adoption tool, $e_4$ determined that by setting $\delta = 0.5$ (a 50% compromise), they could boost the group's consensus to **0.906**, meeting the target while still retaining half of their original domain-specific judgment.

*Table 1: The linear increase of the Consensus Index (CI) as the feedback parameter ($\delta$) increases.*
## Critical Analysis & Conclusion
### Takeaway
The shift from **automated aggregation** to **interactive consensus** is vital. By giving experts "Visual Evidence" of their contribution to the group, the resistance to changing opinions is lowered. Trust propagation ensures that the weights used to aggregate these opinions are grounded in the social reality of the group.
### Limitations & Future Work
The authors note that while the model allows experts to choose $\delta$, it doesn't currently calculate the *optimal* $\delta$ that achieves the threshold with the *absolute minimum* change to the expert's original opinion. Future research into optimization algorithms to find this "minimal change path" would be a valuable extension.
In conclusion, this paper bridges the gap between pure mathematical aggregation and the psychological realities of expert interaction, providing a more robust framework for complex decision-making in the social media and corporate eras.