
ECRM: Beyond Degree Centrality—Using Neighborhood Correlation to Find Social "Super-Spreaders"
KNOWLEDGE‐BASED SYSTEMS
This paper introduces the Extended Cluster Coefficient Ranking Measure (ECRM), a novel centrality metric designed to identify the most influential nodes in social networks. By integrating Pearson correlation of shell hierarchy vectors with neighborhood structural information, ECRM effectively outperforms state-of-the-art algorithms like k-shell and Cluster Rank in information propagation tasks.
TL;DR
In the massive landscape of social networks, identifying influential nodes is vital for viral marketing and information control. This paper presents ECRM (Extended Cluster Coefficient Ranking Measure), a method that uses Pearson correlation of neighborhood hierarchies to determine influence. Unlike traditional methods that only count friends, ECRM looks at how different your friends' social circles are from your own, proving that structural diversity equals spreading power.
Problem & Motivation: The Redundancy Trap
Why do some popular users fail to spark a viral trend? The answer lies in structural redundancy. If all your neighbors are also friends with each other (high local clustering), their influence overlaps. Information gets "trapped" in a tight-knit community rather than bridging out to new territories.
Prior works like k-shell decomposition identify nodes in the "core" of the network, but often fail to distinguish between nodes within the same shell. More recent methods like Cluster Rank penalize nodes with high clustering coefficients, but they treat all common neighbors as equal, ignoring the hierarchical depth of those connections.
Methodology: The Power of Hierarchy Correlation
The core insight of ECRM is that a node's influence is determined by the dissimilarity of its "Shell Vector" compared to its neighbors.
1. The Shell Vector ()
First, the algorithm breaks the network into tiers using a modified k-shell approach. For every node, it constructs a vector: This vector tracks how many neighbors a node has in each hierarchical shell.
2. Correlation as a Penalty
The method then calculates the Pearson correlation coefficient () between a node and its neighbors.
- High Correlation: You and your neighbor are connected to the same types of people (redundant).
- Low Correlation: You and your neighbor provide access to entirely different social strata (influential).
3. Structural Synergy
The final ECRM score sums the "Shell Clustering Coefficients" () over a two-hop neighborhood to ensure that the global position and local diversity are both accounted for.
 Figure 1: Illustration of hierarchical decomposition and neighborhood sets.
Experimental Performance: SOTA Results
The authors validated ECRM using the SIR (Susceptible-Infected-Recovered) model—the gold standard for simulation-based ground truth in network science.
Key Metrics:
- Discrimination Capability: ECRM creates a highly "monotonic" ranking, meaning it can distinguish between almost every node in the network, whereas k-shell often lumps hundreds of nodes into the same rank.
- Accuracy: As shown in the table below, ECRM dominates across almost all datasets.
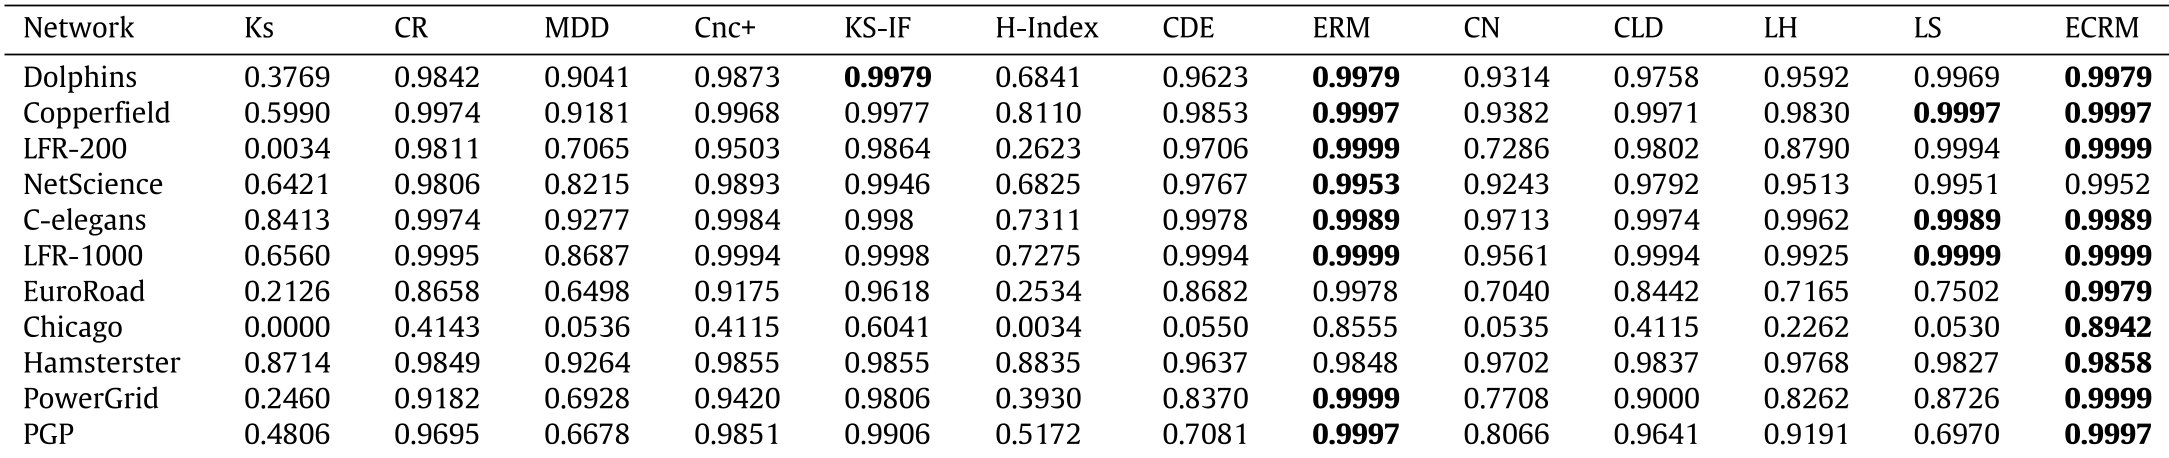 Table 1: Kendall’s Tau correlation. Note ECRM's superior performance in the Chicago and PowerGrid datasets compared to classic k-shell (Ks).
Robustness to Infection Rates
As the infection probability () increases, ECRM remains the most consistent predictor of a node's true spreading range, even when the network structure is sparse or highly assortative.
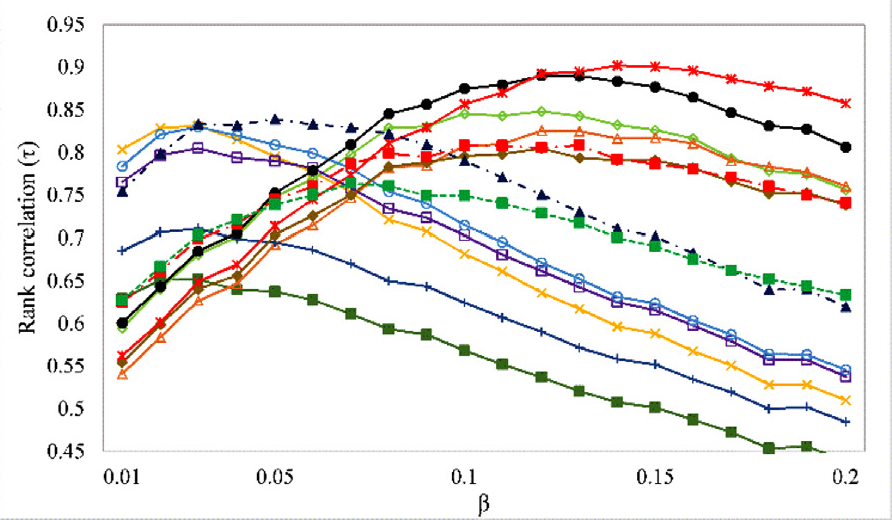 Figure 2: Accuracy of ECRM compared to state-of-the-art algorithms across different infection rates.
Critical Analysis & Conclusion
Takeaway: The real value of ECRM is its ability to quantify structural diversity through mathematical correlation. By moving from "counting" neighbors to "analyzing" neighbors' positions, it provides a much sharper tool for influence maximization.
Limitations:
- Computational Overhead: While it is for large graphs, calculating Pearson correlations for every edge is still more intensive than simple degree counting.
- Static assumption: The model assumes a fixed network structure, whereas real social networks are dynamic.
Future Outlook: ECRM sets a new benchmark for "structural similarity" metrics. The next logical step would be to apply this Pearson-based shell analysis to weighted graphs or multi-layer networks where edges represent different types of social interaction.