
SoNBO Visualiser: Bridging the Gap Between Enterprise Silos and Social Knowledge Graphs
Knowledge Graph for the Visualisation of CRM Objects in a Social Network of Business Objects (SoNBO): Development of the SoNBO Visualiser
The paper introduces the SoNBO Visualiser, a tool designed to create and visualize Enterprise Knowledge Graphs (EKG) using the "Social Network of Business Objects" (SoNBO) approach. It enables the collaborative design of company-specific ontologies and their instantiation into knowledge graphs to integrate data from heterogeneous Enterprise Systems.
TL;DR
Integrating fragmented enterprise data (ERP, CRM) remains a nightmare for most organizations. The SoNBO Visualiser offers a breakthrough by treating business objects (invoices, employees, projects) as nodes in a social network. Built on a two-level ontology approach, it allows non-technical domain experts to collaboratively design knowledge graphs that provide a "unified language" for distributed corporate data.
Background: Why Enterprise Systems are "Anti-Social"
Historically, information in companies is trapped in silos. An employee trying to find "everything related to Project X" might have to hop between three different systems. While Ontology-Based Information Integration (OBII) aims to solve this, most current tools are built for "Semantic Web scientists" who think in RDF/OWL, leaving the actual business experts—the ones who know the data best—out of the loop.
The Problem & Motivation
The authors argue that existing tools lack the human involvement necessary for tailoring ontologies to specific business needs. The primary friction points are:
- Complexity: Subject-predicate-object logic is unintuitive for business managers.
- Abstraction Gap: There is no clear visual distinction between high-level concepts (e.g., "Person") and specific subcategories (e.g., "Student Assistant").
- Mapping Rigidity: Connecting live data to an abstract graph usually requires heavy programming.
Methodology: The SoNBO Core Insight
The "Social Network of Business Objects" (SoNBO) approach flips the script by using a proprietary, user-friendly visualization instead of standard machine-focused languages.
The Two-Level Ontology
The system splits the design into two distinct layers:
- SoNC (Concepts): High-level nodes like "Person" or "Sales Document."
- SoNSC (Subconcepts): Specific instances like "Professor" or "Invoice."
By inheriting relationships from the concept level to the subconcept level, the tool ensures structural integrity while maintaining flexibility for domain experts.
Architecture & Mapping
The prototype utilizes a NoSQL (HCL Domino) backend and a vis.js frontend. The "Magic" happens in the mapping area where users can link a node (e.g., "PhD Student") to a specific database view via simple key-value pairs (JSON).
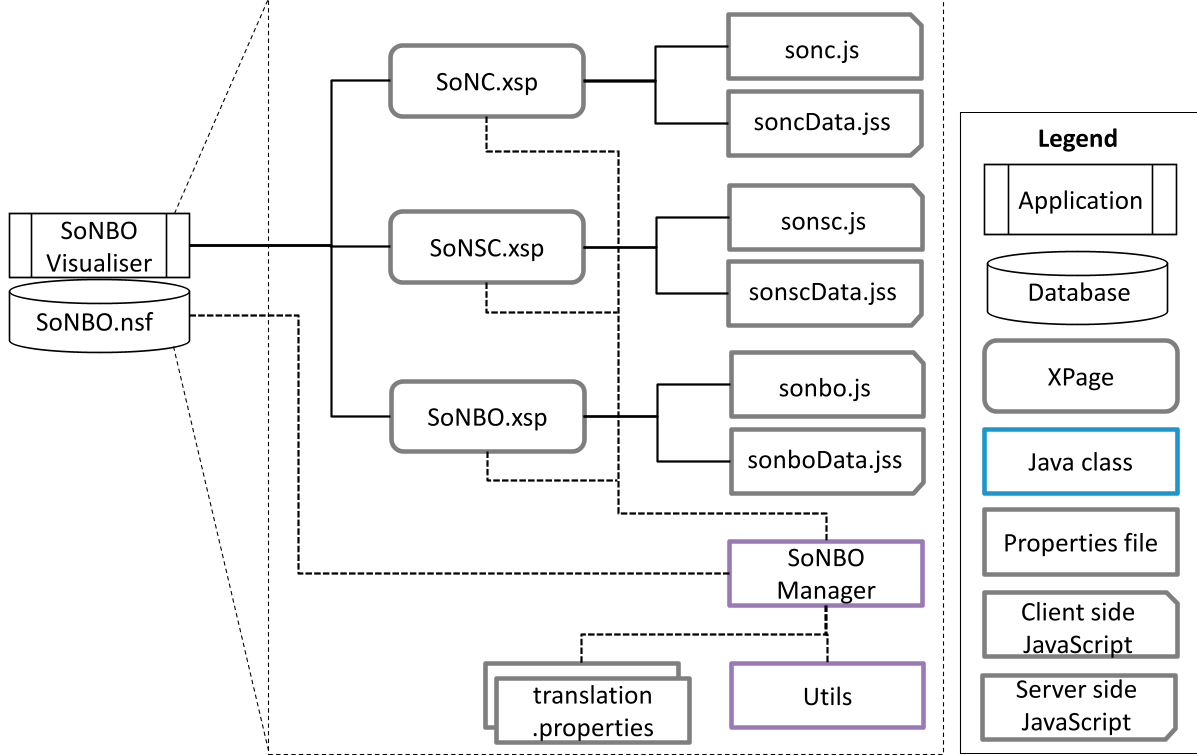 Figure 1: The architectural interplay between the Visualiser frontend, the application layer, and CRM/ERP source systems.
Experiments & Results
The authors validated the tool using a dual-track evaluation:
- Internal CRM Data: Visualizing university research groups, showing how "Research Assistants" (nodes) are linked to "Projects" (edges) across disparate systems.
- Industrial Case Study: A media publishing company used the tool to map ERP data (suppliers and products).
The key result was the collaborative efficiency: SoNBO experts, IT experts, and Domain experts were able to stand around a screen and "build" the company's information DNA in real-time.
 Figure 2: From abstract Concepts (left) to specific Subconcepts (middle) and finally the instantiated Business Objects (right).
Critical Analysis & Conclusion
Takeaway
The SoNBO Visualiser demonstrates that User Experience (UX) in ontology design is not just a "nice-to-have"—it's a requirement for accurate data integration. By using a "social network" metaphor, the tool makes complex graph theory accessible to every department.
Limitations & Future Work
While the technology-agnostic design is a strength (using JSON APIs), the current prototype is heavily rooted in the HCL Domino ecosystem. Future iterations would benefit from broader native support for SQL-based relational databases and automated suggestion of relationships using AI to further reduce the "configuration manual labor."
Ultimately, this work serves as a foundational step toward a future where enterprise data isn't just stored; it's socially connected and visually navigable.