
Knowledge Mining with Genetic Programming: Decoding the Science of Taste
Knowledge mining with genetic programming methods for variable selection in flavor design
This paper introduces a knowledge mining framework using Genetic Programming (GP) based symbolic regression for variable selection in flavor design. By employing the ParetoGP algorithm to generate model ensembles from sparse, repeated-measure sensory data, the authors achieve high-fidelity preference modeling that outperforms traditional linear regression benchmarks.
TL;DR
Researchers from MIT, University of Antwerp, and Givaudan have developed a way to "mine" the secrets of human flavor preference using Genetic Programming (GP). By treating each person's palate as a unique mathematical function, they've moved beyond simple averaging to a system that can predict precisely which ingredients drive a person's "liking" score, even when data is extremely limited.
Background: The "Small Data" Challenge in Flavor Science
In the world of flavor design, data is notoriously difficult. Creating and testing a new flavor involves human tasters (panelists), making it expensive and time-consuming. This results in sparse datasets: you might have 40 flavors but 7 variables (ingredients), with thousands of potential combinations left untested.
The standard industry approach is to average the scores of all panelists. However, as this paper argues, averaging is an information killer. If Panelist A loves salt and Panelist B hates it, the average says salt is "neutral"—a conclusion that satisfies neither.
The Problem & Motivation
The paper identifies three critical pain points:
- High Variance: The same flavor can receive a "1" and a "9" on a 9-point scale from different people.
- Sparsity: With possible ingredient combinations, testing only 40 is a drop in the bucket.
- The Hidden "Why": Scientists need to know not just if a flavor is liked, but which ingredient is responsible (Variable Selection) and how much of it is needed (Sensitivity Analysis).
Methodology: The Core of ParetoGP
Instead of building one "best" model, the authors use ParetoGP Symbolic Regression.
1. Multi-Objective Evolution
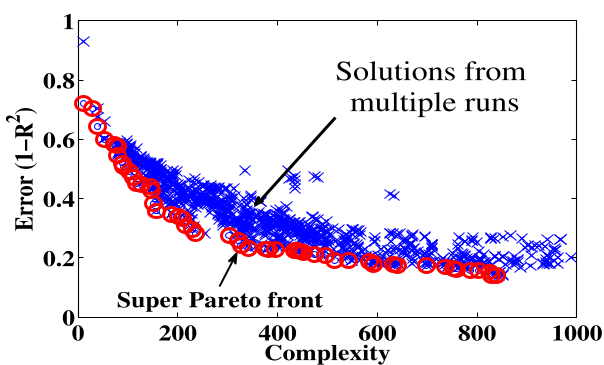
The algorithm evolves mathematical equations that relate ingredient concentrations () to liking scores. It optimizes for two conflicting goals:
- Minimize Error: How well does the formula fit the data?
- Minimize Complexity: Is the formula simple enough to be physically meaningful?
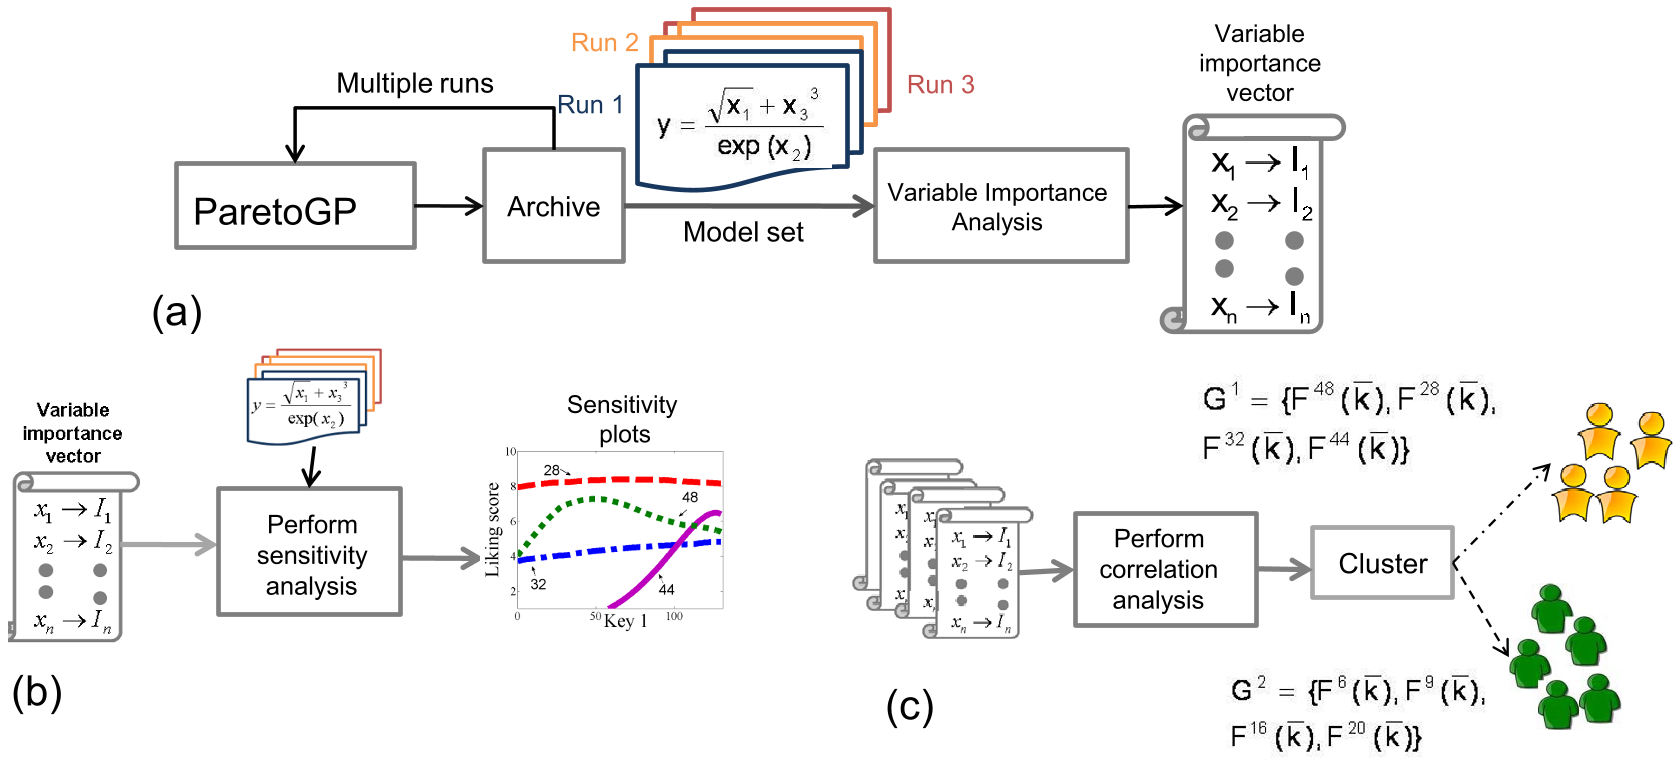 The process flow: from ParetoGP model generation to Variable Importance, then to Clustering and Sensitivity Analysis.
2. Variable Importance Metrics
The researchers developed two ways to see which ingredients matter:
- Presence-Weighted (PW): Simply counting how often an ingredient appears in the best models.
- Fitness-Weighted (FW): Giving more "weight" to ingredients found in highly accurate, simple models. This proved more effective at filtering out "noise" variables.
Experiments & Results: Beyond the Average
The results were striking. When modeling the panel as a whole, the error rate was nearly 92%—essentially useless. But by modeling each panelist individually, the error dropped to 20%.
Panelist Segmentation
By comparing the "Importance Vectors" of different panelists, the team grouped them into clusters.
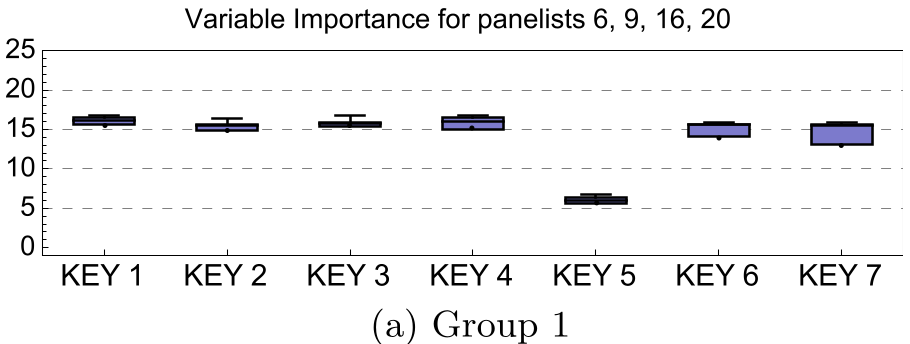
- Group 1: Driven by almost all ingredients except .
- Group 2: Driven by almost all ingredients except .
 Comparison of variable importance across 69 panelists, showing the extreme diversity in what people actually care about.
Sensitivity Analysis: The "Taste Direction"
The research finally answers the most important question: "If I add more of ingredient , will they like it more?" The study found that even within a group that cares about the same ingredient (e.g., ), people can have opposite reactions. In Group 1, some panelists showed a monotonically increasing liking for , while others showed a decreasing trend.
 Sensitivity analysis for ingredient k1. Notice how segment 9/20 goes down while segment 6/16 goes up.
Deep Insight & Perspective
This paper is a masterclass in Knowledge Mining. It proves that Symbolic Regression is not just about fitting a curve; it's about extracting the underlying "physics" (or in this case, the "biology") of the problem.
Takeaway: In any domain where "human preference" is the target—be it flavor design, UI/UX, or personalized medicine—avoiding the "average" is the key to breakthrough performance.
Limitations: The study relies on high-quality experimental design (DOE) to start with. If the initial 40 flavors are poorly chosen, even the best GP won't find the truth. Furthermore, while GP finds correlations, the "why" of human biology remains a black box for further study.