
You Are What You Check-in: Mapping Global Cultures Through Urban Data
A large-scale study of cultural differences using urban data about eating and drinking preferences
2017-10-14
Summary
Problem
Method
Results
Takeaways
Abstract
This paper presents a large-scale study using Foursquare location-based social network (LBSN) data to map global cultural boundaries based on food and drink preferences. By analyzing over 4.5 million check-ins across different time periods, the authors developed a methodology that automatically clusters geographic areas (countries, cities, and neighborhoods) into cultural zones, achieving results that highly correlate with traditional sociological surveys like the World Values Survey (WVS).
## TL;DR
Researchers have successfully used Foursquare check-in data to redraw the cultural map of the world. By analyzing the "when" and "where" of our eating and drinking habits, this study demonstrates that digital footprints can replace expensive, decades-old sociological surveys to identify cultural boundaries at scales ranging from global continents to specific city neighborhoods.
## Background: The End of Expensive Surveys?
For decades, understanding culture meant professional pollsters conducting face-to-face interviews. While projects like the **World Values Survey (WVS)** provided the gold standard for cultural mappings, they are static and expensive. This paper asks a radical question: *Can we use the "digital breadcrumbs" of our lunch choices and coffee breaks to define a culture?*
The authors argue that food and drink are fundamental cultural markers. Using LBSN data, they move beyond "what people say" (surveys) to "what people do" (check-ins).
## The Methodology: Extracting "Cultural Signatures"
The core innovation lies in the **Spatio-Temporal Feature Vector**. The researchers didn't just look at *what* people ate; they looked at *when* they ate it.
1. **Categorization**: Venues were split into **Drink**, **Fast Food**, and **Slow Food**.
2. **Temporal Slicing**: Check-ins were bucketed into Dawn, Morning, Afternoon, and Night across Weekdays and Weekends.
3. **The Signature**: Each area (city or country) was represented by an 808-dimensional vector, normalized to capture the "rhythm" of the locality.

*Fig 1: The workflow of mapping user preferences to geographic cultural signatures.*
## Insights: The "Globalized" Burger vs. The "Cultural" Sit-down
One of the most profound findings of the study relates to the **homogenization of taste**.
* **Fast Food as a Bridge**: The data shows that Fast Food habits are remarkably similar worldwide. Whether in Tokyo or New York, the behavior around quick meals is consistent, likely due to the global diffusion of franchises like McDonald's.
* **Slow Food as a Barrier**: "Slow Food" (traditional restaurants) remains the strongest indicator of cultural boundaries. The temporal patterns for these venues varied wildly—for example, Brazilians take a heavy lunch at noon, while many Western cultures peak during dinner time.
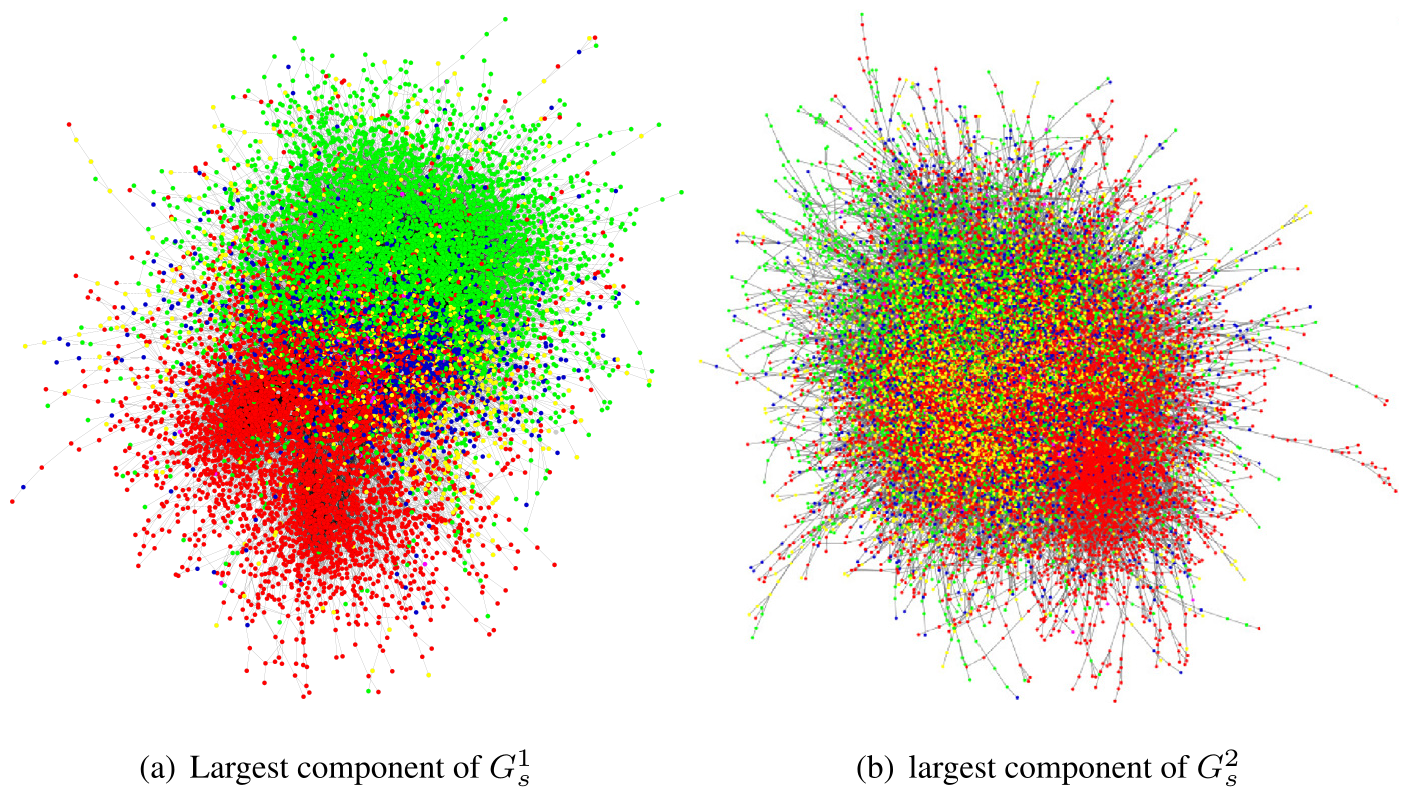
*Fig 2: Spatial correlations of habits. Note how Slow Food (c) shows much sharper distinctions between countries than Fast Food (b).*
## Validating the Digital Map
To ensure this wasn't just "noise," the researchers clustered their data and compared it to the **Inglehart-Welzel map**.
* The results were striking: the LBSN-derived clusters (Catholic Europe, English-speaking, etc.) aligned closely with traditional sociological models.
* **The Chinatown Effect**: At the city level, the algorithm was precise enough to identify NYC's Chinatown (NY-7) as being more culturally similar to areas in Tokyo than to other nearby Manhattan neighborhoods.
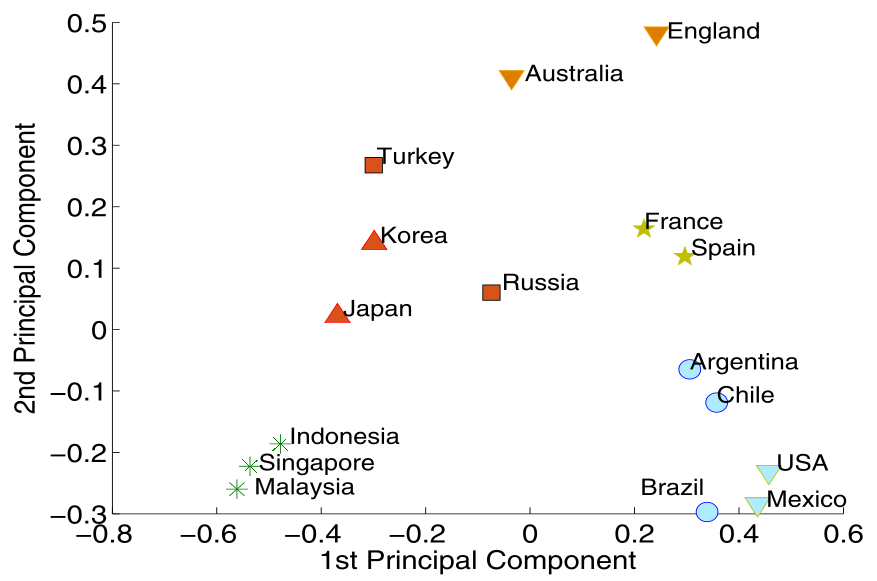
*Fig 3: PCA-based clustering of global cities. Observe how geographical neighbors aren't always cultural neighbors.*
## Critical Analysis & Conclusion
**The Takeaway**: This work proves that urban data mining is a viable and "cheaper" alternative for automatic cultural habit separation. It opens the door for **Cross-Cultural Recommendation Systems**—imagine a travel app that suggests a neighborhood in London because its eating and drinking "rhythm" matches your favorite district in Tokyo.
**Limitations**: The authors openly admit that LBSN users (often younger, tech-savvy, and wealthier) do not represent the entire population. Furthermore, "spam" check-ins and the self-reported nature of the data introduce potential biases.
**Future Outlook**: As we move into an era of even more granular data (Instagram stories, real-time mobility), the ability to "read" a city's culture through its digital pulse will become an essential tool for urban planners and global marketers alike.