
Beyond the Coordinate: Unveiling the Hidden Biases of Twitter's Geotagging Behavior
A large-scale empirical study of geotagging behavior on Twitter
This paper presents a large-scale empirical study of geotagging behavior on Twitter using a massive dataset of 40 billion tweets from 20 million users. The researchers identify significant systematic variances in geotagging preferences influenced by language, device type, and social network homophily, challenging the assumption that geotagged users are representative of the general population.
TL;DR
Researchers often treat geotagged tweets as a transparent window into global movement and opinion. However, a massive study from Carnegie Mellon University involving 40 billion tweets proves this window is tinted. Geotagging is not random; it is a choice influenced heavily by your language, your phone, and who you follow.
Background: The Representative Trap
In the world of Computational Social Science, geotags are gold. They allow us to track disease outbreaks, detect earthquakes, and map political sentiment. But there is a massive underlying assumption: geotagged users are just like everyone else. If this is false, our maps of "public opinion" are actually just maps of "the opinions of people who like sharing their location."
This study by Huang and Carley provides the empirical evidence needed to debunk the "same distribution" myth.
Why People Geotag (or Don't): The Insights
1. The Linguistic Divide
The study finds that language is one of the strongest predictors of geotagging.
- The Overshared: Indonesian, Portuguese, and Turkish speakers are highly likely to geotag (over 35-40% of users).
- The Private: Korean and Japanese speakers are incredibly conservative, with less than 3% sharing location data.
This creates a "participation gap." If an analyst sees more geotagged tweets about climate change in Jakarta than in Tokyo, it might not mean Indonesians care more—it just means they are 40 times more likely to show you where they are.
2. Device Elitism
The "Source" of a tweet matters. iPhone users are more likely to geotag than Android users (29.2% vs 23.9%). More interestingly, 3rd-party apps like Instagram and Foursquare are the primary drivers of precise coordinate sharing. Instagram's coordinates-tagging rate is nearly 35 times higher than the average tweet source.
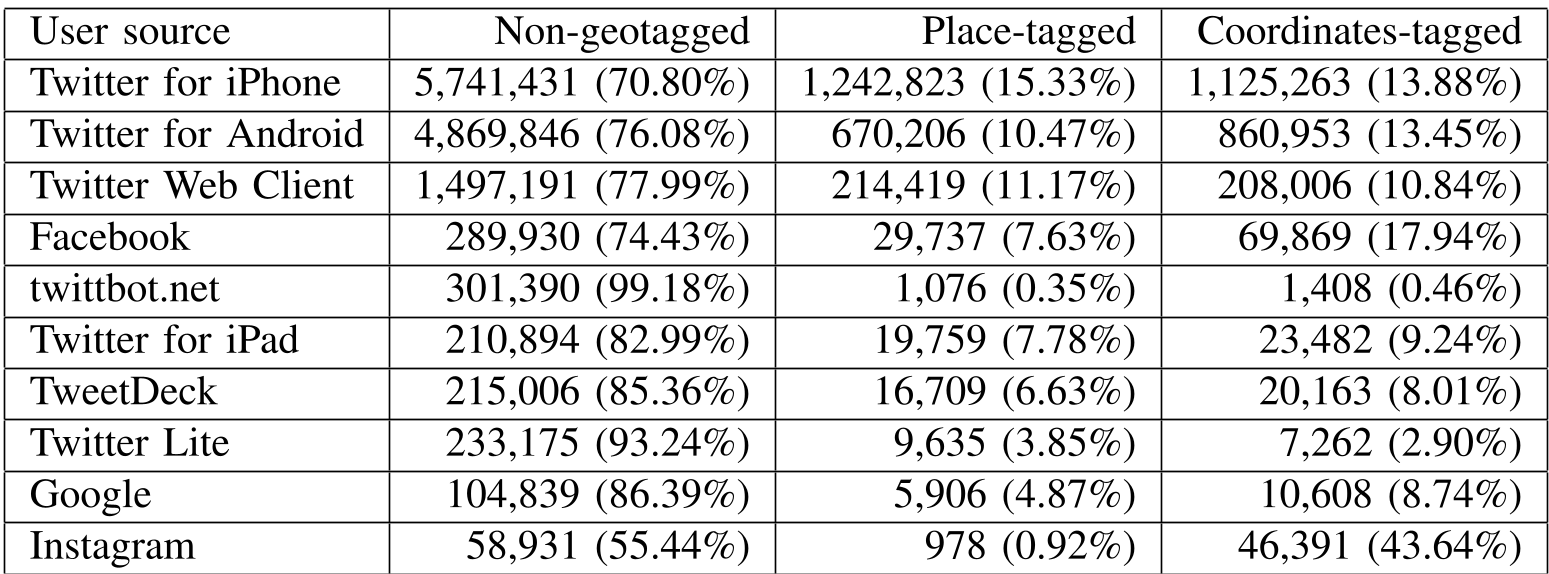 Table: Distribution of geotagging across different platforms. Instagram stands out as a major source of precise data.
3. The "Birds of a Feather" Effect (Homophily)
One of the paper's most striking findings is the social influence of geotagging. Geotagging is contagious.
- If you have at least one friend who geotags, you are 6 times more likely to geotag yourself.
- This suggests that location sharing is a socialized behavior—once it becomes a "norm" in your circle, you are likely to adopt it.
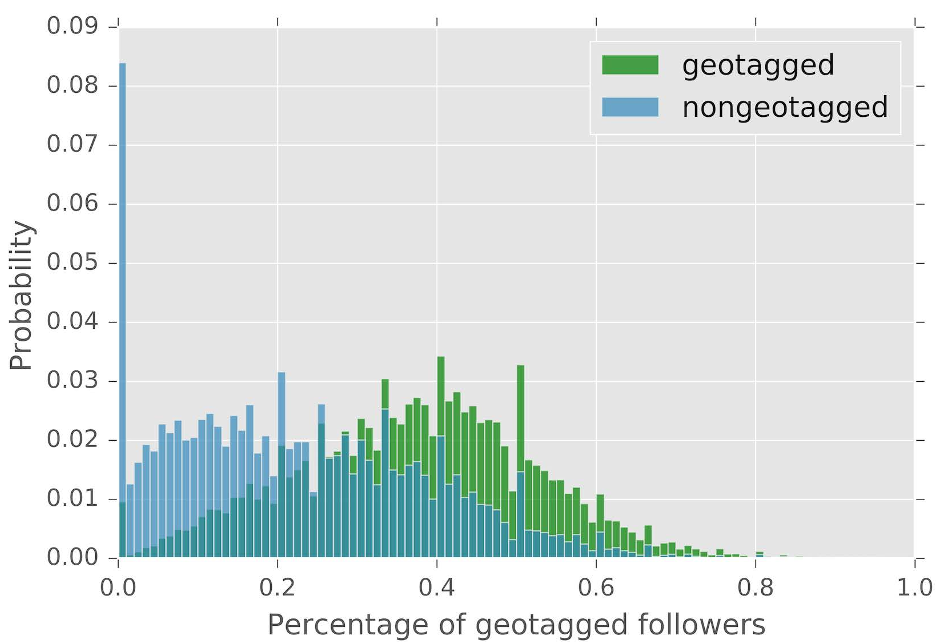 Figure: The clear separation in distributions shows that geotagged users cluster together in the social graph.
Methodology: High-Fidelity Data
Unlike previous studies that relied on a 1% "gardenhose" sample (which misses most tweets for any single user), Huang and Carley used the REST API to pull full timelines. This revealed that while only 2% of tweets are geotagged, nearly 25% of users have geotagged at least once. This indicates that the potential pool for location inference is much larger than previously thought—if you know where to look.
Critical Analysis: The Impact on SOTA
This paper directly challenges current State-of-the-Art (SOTA) location predictors. Most predictors are trained on geotagged users to predict the location of non-geotagged users.
However, the authors found that geotagged users are also more likely to have recognizable "Home Locations" in their profiles. This creates a selection bias: our models are getting really good at predicting the locations of people who are already telling us where they are, but they may remain fundamentally flawed when applied to truly "dark" (invisible) users.
Conclusion: A Call for Weighted Research
The takeaway for the industry is clear: Stop treating all tweets as equal.
- Linguistic Weighting: When aggregating global sentiment, researchers should weight Japanese tweets more heavily and Indonesian tweets less heavily to account for the disparity in geotagging propensity.
- Graph Awareness: Location prediction models must account for the fact that non-geotagged users tend to cluster together, creating "dark zones" in the social graph that require different inference strategies.
This study serves as a vital "reality check" for the era of Big Data, reminding us that the data is only as good as our understanding of the humans who generated it.