
Decoding Nationwide Student Behavior: A 9-Billion DNS Query Deep Dive
Large-Scale Internet User Behavior Analysis of a Nationwide K-12 Education Network Based on DNS Queries
This paper presents a large-scale analysis of over 9 billion DNS query records from Uruguay's nationwide K-12 education network (Plan Ceibal). By applying unsupervised machine learning techniques (PCA and K-means), the authors characterize Internet behavior patterns across different age groups and time slots.
TL;DR
Researchers analyzed a massive dataset of 9.1 billion DNS queries from Uruguay’s Plan Ceibal—the world’s only nationwide one-to-one computing program. Using unsupervised machine learning, they discovered that student Internet behavior is intensely structured by age and class schedules but surprisingly uniform across different geographical regions.
Context: The Unique Landscape of Plan Ceibal
Since 2007, Uruguay has been a pioneer in digital inclusion, providing laptops and connectivity to nearly every public school student (ages 6-18). Managing this scale requires more than just hardware; it requires an understanding of how hundreds of thousands of children navigate the web. While most DNS research focuses on blocking "bad guys" (phishing, botnets), this study focuses on understanding the "users" to better design educational infrastructure.
Methodology: From Raw Logs to PCAs
The authors leveraged a Big Data stack (Hadoop, Spark, Hive) to process logs collected via Cisco Umbrella. Each query was categorized into labels like Search Engines, Social Networking, or Educational Institutions.
The core analysis relied on:
- Principal Component Analysis (PCA): To reduce the 14 category dimensions into 2D visualizations.
- K-Means Clustering: To find natural groupings in behavior.
- Silhouette Method: To mathematically determine the optimal number of clusters ( for age groups; for time slots).
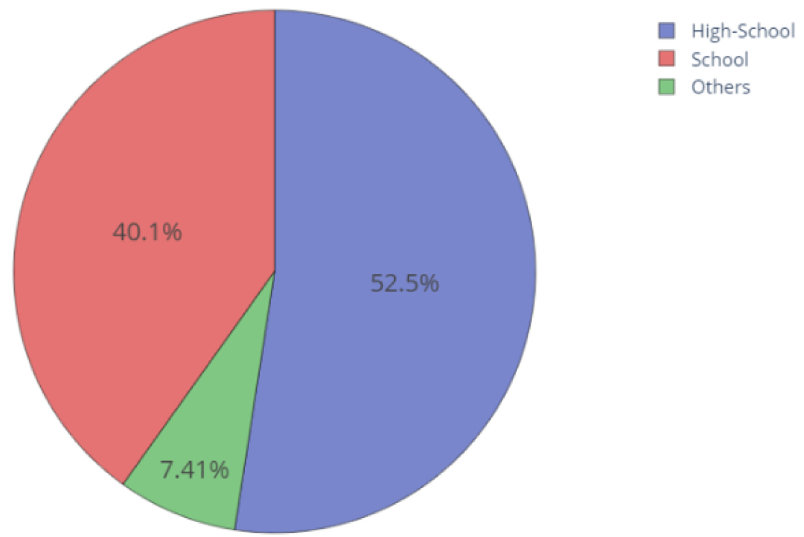 Figure: Distribution of the top 14 DNS categories across the network.
Key Insights: Age and Time are the Only Real Dividers
1. The High School vs. Primary School Gap
The PCA biplot (below) shows a clean separation between primary schools (left) and high schools (right).
- Primary students: Usage is tightly clustered and more predictable, focusing heavily on educational content.
- High school students: Show a much higher variance (). They are significantly more likely to access Social Networking, Video Sharing, and Photo Sharing—even during formal class hours.
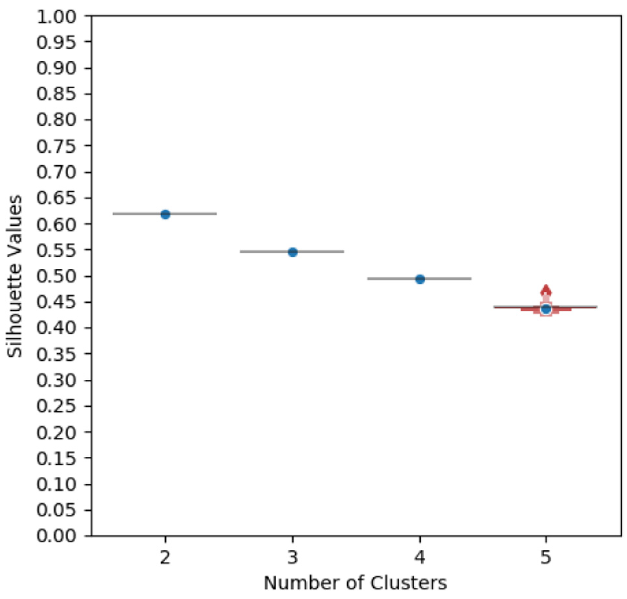 Figure: The behavioral "DNA" of primary schools vs. high schools.
2. The Daily Rhythm
By clustering usage by the hour, researchers identified three distinct "phases" of the day:
- School Hours (Morning/Afternoon): Peak educational and search activity.
- Evening: A transition period where engagement shifts.
- Late-Night: Low activity, though high school students remain active longer, likely due to more demanding study schedules.
Interestingly, Social Networking peaks around noon—exactly when students are shifting between morning and afternoon sessions.
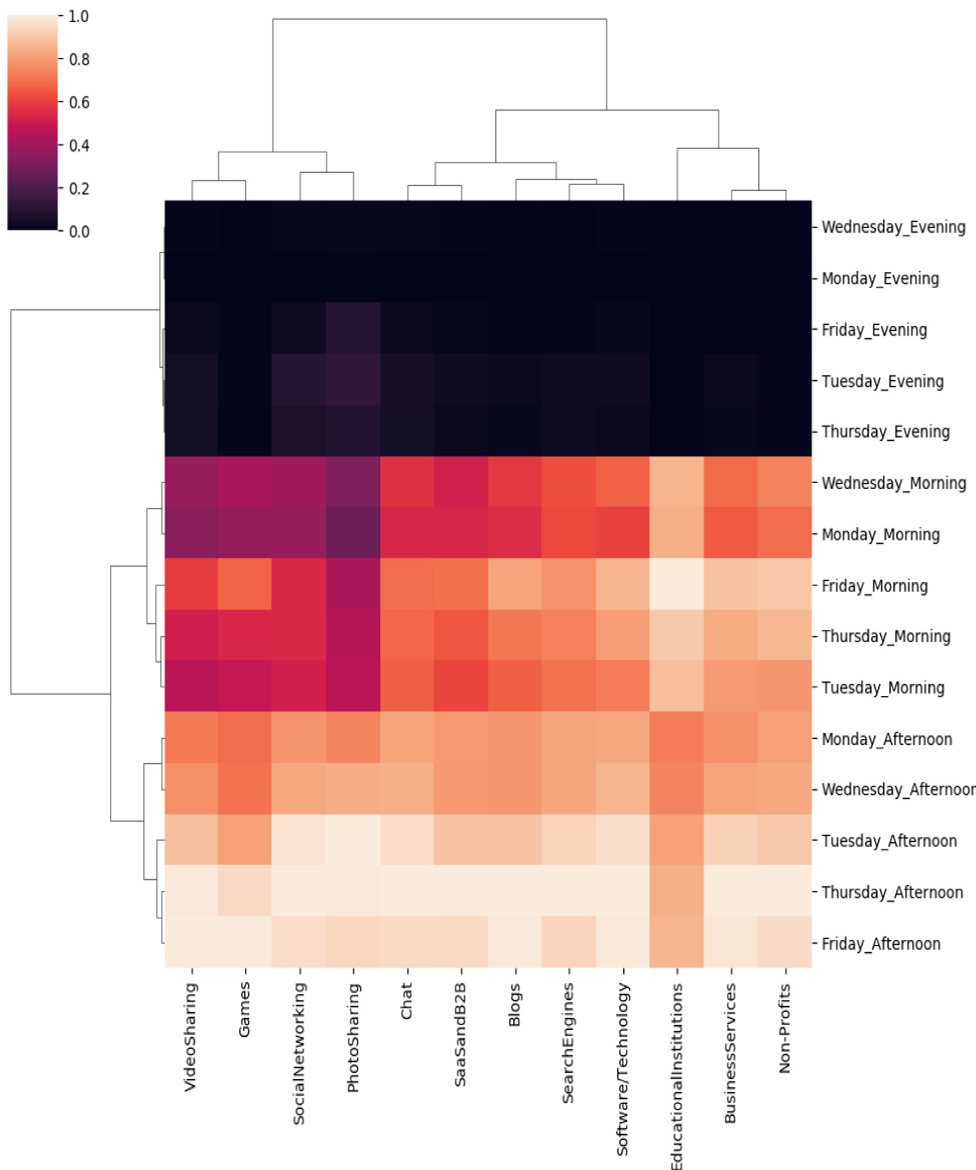 Figure: Heatmap showing the intensity of different website categories throughout the week.
3. Geography Doesn't Matter
One of the most striking findings is that student behavior in Montevideo (the urban capital) is statistically identical to that in rural, remote provinces. This suggests that the nationwide educational policy and shared digital curriculum have successfully created a uniform digital experience across the country.
Critical Analysis & Future Value
This paper proves that DNS data is a "gold mine" for learning analytics. By knowing what categories are accessed and when, ESPs can:
- Optimize Bandwidth: Prioritize educational domains during peak school hours.
- Tailor Security: High schools need different filtering policies than primary schools, given their higher engagement with social media.
- Evidence-based Policy: Identify which educational platforms are actually being used "in the wild."
Limitations: The study uses categorized data, which obscures the specific sub-domains. It also treats all "Non-Category" traffic as a monolith, potentially missing emergent trends in new apps or platforms popular among Gen Z.
Conclusion: As more countries look toward one-to-one computing, Uruguay’s data-driven approach provides a blueprint for using infrastructure logs to refine the educational experience.