
Scaling Urban Intelligence: How WeChat Data and TLDA are Redefining Cultural Planning
Discovering Latent Patterns of Urban Cultural Interactions in WeChat for Modern City Planning
The paper introduces a data-driven framework for urban cultural planning using a massive longitudinal WeChat check-in dataset from Beijing. It proposes a Temporal Latent Dirichlet Allocation (TLDA) model to identify six latent cultural interaction patterns and a Demand-Supply Interaction (DSI) model to map resource gaps.
TL;DR
Researchers from the University of Cambridge and NYU have leveraged 56 million WeChat check-ins to create a high-resolution map of cultural "demand vs. supply" in Beijing. By introducing Temporal LDA (TLDA) and the POPTICS algorithm, they can identify where the city lacks museums, gyms, or parks based on actual behavioral patterns rather than just where people live.
The "Static" Planning Problem
Why is it that some city parks are overcrowded while others sit empty? The culprit is often population-density-based planning. Traditionally, governments allocate resources based on where people sleep (Census data). However, human culture is dynamic: we travel for music, exercise in the evenings, and visit museums on specific seasonal schedules.
The authors argue that existing urban computing models fail because:
- They ignore temporal sensitivity (when activities happen).
- They lack practical application (identifying specific underserved city grids).
Methodology: The TLDA and DSI Framework
1. Temporal Latent Dirichlet Allocation (TLDA)
While standard LDA treats check-ins as a "bag of words," the proposed TLDA treats them as a Spatio-Temporal Cube. It samples pattern distributions not just of the user and the venue, but also of the time.
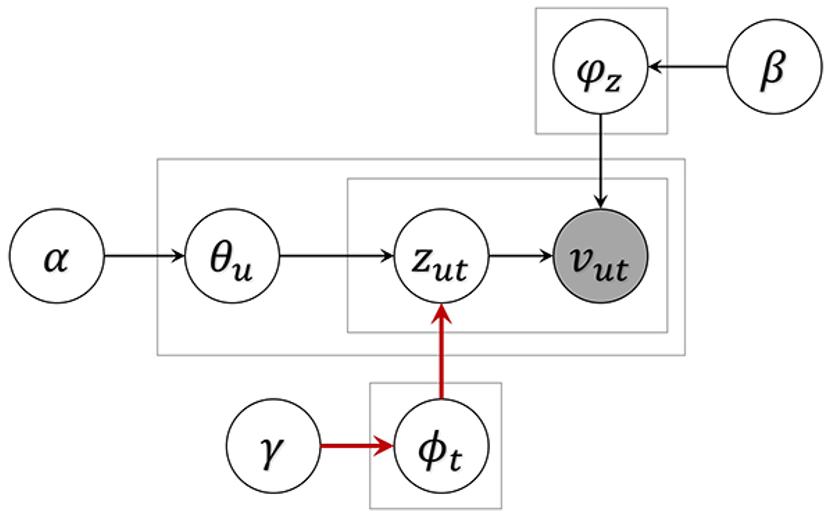 Figure 1: The TLDA Graphical Model extending traditional LDA with a temporal layer (red arrows).
2. POPTICS: Personalized Activity Hotspots
Since different users have different activity frequencies, a "one-size-fits-all" clustering threshold fails. The authors developed POPTICS, which adapts the density threshold for each user to find their unique "active centers" (e.g., home/work hubs) and "influence radii."
3. The Demand-Supply Interaction (DSI) Model
This is where the math meets the map.
- Demand (): Aggregated Gaussian influence of all users in a specific cultural pattern center.
- Supply (): Calculated capability of venues based on the standard deviation of historical visitor travel distances.
- DSR (Demand-Supply Ratio): The ultimate planning metric. High DSR = Priority for Investment.
Experiments: 6 Cultural "Tribes" of Beijing
Using a Temporal Coherence Value (TCV) to optimize the model, the team identified 6 distinct latent patterns:
- The Gym Lovers: Highly active in evenings, negligible morning activity.
- The Museum Lovers: Active in the afternoon, notably "closed" on Mondays.
- The Sports/Swimming Fans: Highest percentage of nighttime activity.
- The Nature Lovers: Strictly daytime, weather-sensitive.
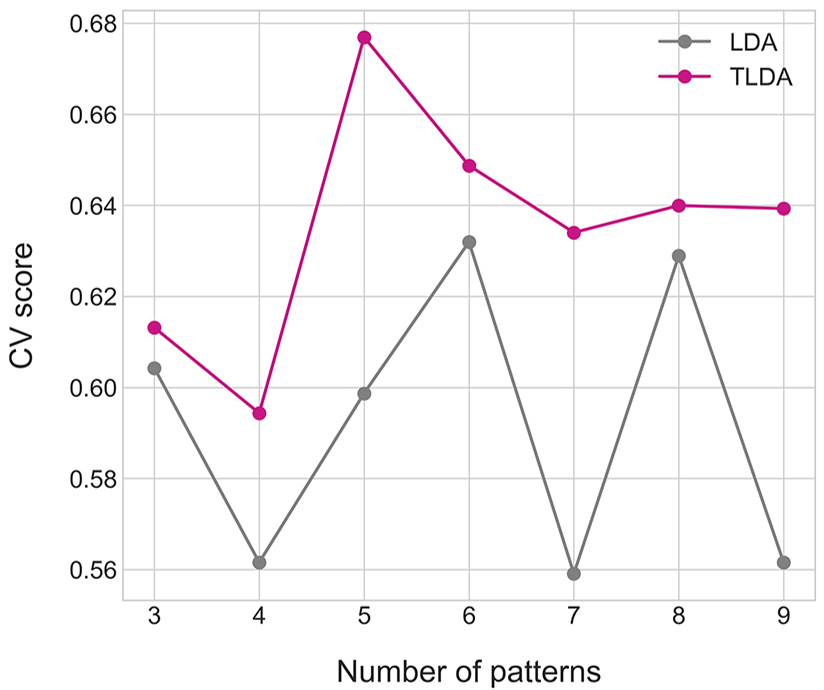 Figure 2: Probability distributions showing how different venue categories cluster into 6 latent patterns.
Spatial Insights & Validation
The results revealed that while the city center (inside the 2nd ring) is generally well-served, specific areas in Xicheng and Dongcheng districts are in "Great Need" of parks and swimming pools (Patterns 1 & 5).
To validate this, the authors checked the correlation between their DSR and actual travel distance. They found a strong positive correlation (Figure 10 in the paper): people in high-DSR areas were forced to travel much further to satisfy their cultural needs, proving the local "supply gap" was real.
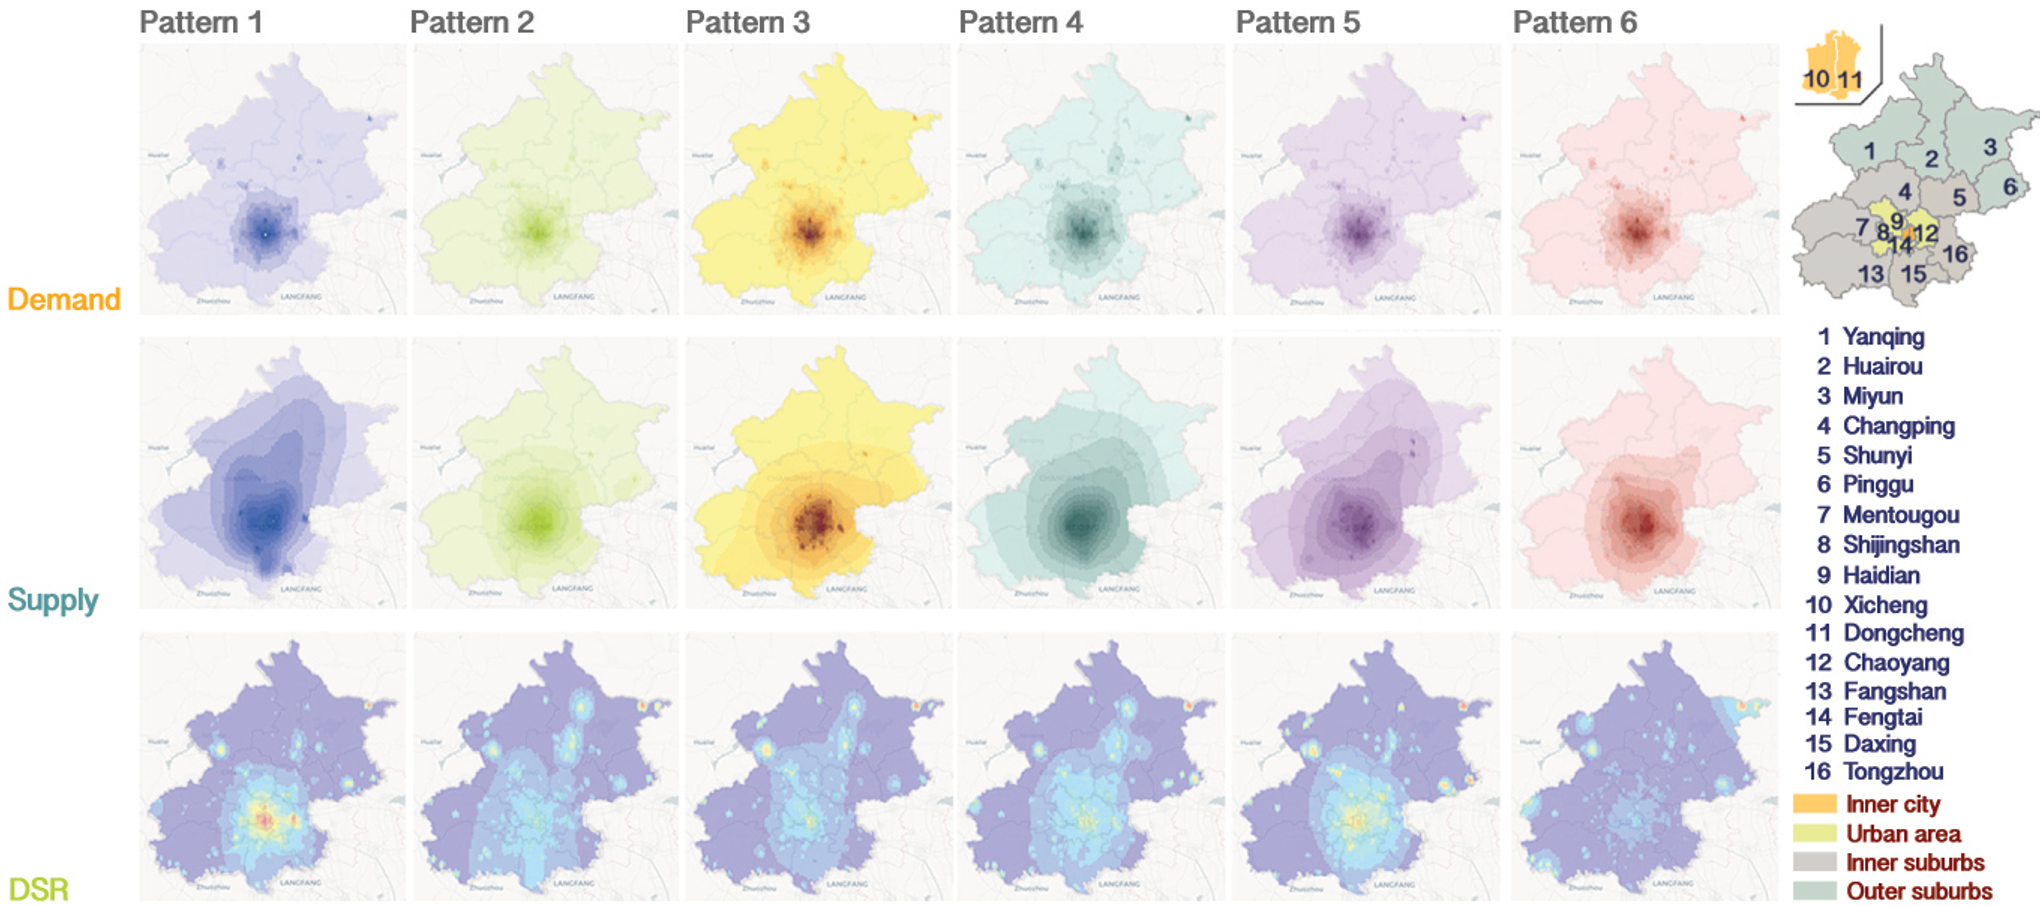 Figure 3: High-resolution heatmaps showing Demand, Supply, and the final DSR for different patterns across Beijing.
Final Thoughts: The Future of Adaptive Cities
This study is a masterclass in turning "Social Big Data" into "Urban Policy." By moving beyond residential-only models, cities can become adaptive ecosystems.
Limitations: The study relies on WeChat users who engage with the 'Moments' feature, which might under-represent groups that don't share their location (e.g., high-privacy individuals or the very elderly). However, with a 97% penetration rate in Beijing, the data is as close to a continuous urban census as we have ever achieved.