
Visualizing the Social Bridge: A Role-Based Layout Algorithm for Community Interaction
Layout Algorithm for Clustered Graphs to Analyze Community Interactions in Social Networks
This paper introduces a specialized layout algorithm for clustered graphs aimed at visualizing community interactions in social networks. By categorizing nodes into "border nodes" (inter-community connectors) and "inner nodes" (intra-community members), the method achieves a clear representation of cross-group information flow and structural roles.
TL;DR
This research presents a novel way to look at social networks by shifting the focus from who is in which group to how groups talk to each other. By mathematically separating "border nodes" (the bridges) from "inner nodes" (the core), the algorithm creates a focused "Interaction Zone" that reveals the hidden dynamics of information viralization.
Motivation: The Problem with Isolationist Layouts
In traditional graph visualization, clusters are often treated like islands—pushed far apart to make the groups distinct. While this looks clean, it creates a massive blind spot for social researchers: The Interaction Gap.
Social roles like "mediators," "facilitators," or "information brokers" exist precisely at the boundaries between groups. When a layout algorithm prioritizes cluster separation, these vital actors are often lost in the noise of the cluster's periphery. The authors argue that to understand a social network, we must prioritize the connective tissue over the organs.
Methodology: The Border-Inner Schema
The core innovation lies in a binary classification of nodes based on their neighborhood structure:
- Border Nodes (): Nodes that have at least one link to a community other than their own.
- Inner Nodes (): Nodes whose neighbors reside strictly within the same community.
Phase 1: The Interaction Zone
The algorithm identifies all border nodes regardless of their community and places them in the center of the canvas using Multi-Dimensional Scaling (MDS). This creates a circular "Interaction Zone" where proximity indicates structural similarity. If two border nodes from different communities are close, it implies they share similar bridging roles or common neighbors.
Phase 2: Directed Expansion
Inner nodes are then placed outside this central zone. For each community , the algorithm calculates the centroid of its border nodes and projects the inner nodes outward along that vector.
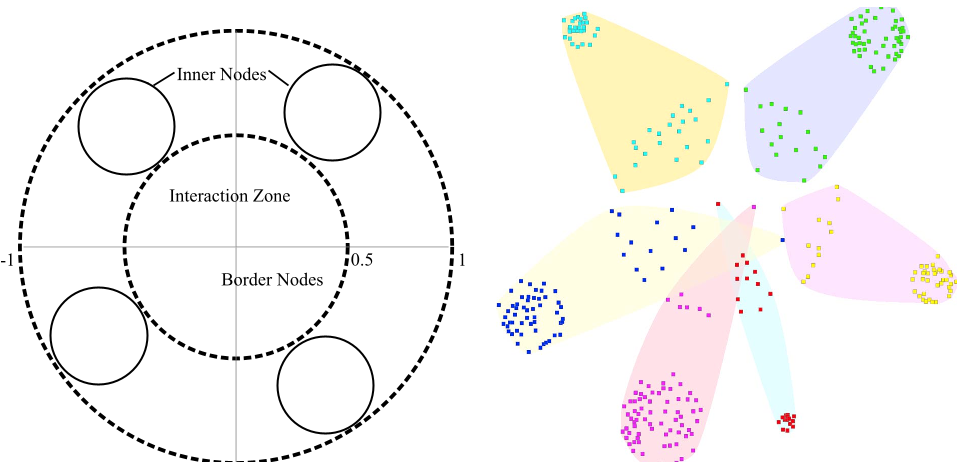 Figure 1: (a) Conceptual placement showing the central Interaction Zone versus Cluster Zones. (b) The actual placement of inner nodes relative to their boundary actors.
Experiments: Tracking Viral Sentiments
The authors tested this on a real-world Twitter dataset involving a viral promotional video. Communities were partitioned by sentiment (Positive, Neutral, Negative, Very Negative).
While a standard layout would simply show four blobs of color, this algorithm highlighted the Interaction Zone. Researchers were able to pinpoint specific Twitter accounts that acted as catalysts, spreading messages across the "Positive" and "Neutral" boundaries, or fueling the "Negative" fire.
Critical Insight & Conclusion
By moving away from pure force-directed models (which often struggle with hairball effects in dense networks) and toward a role-informed layout, the authors provide a tool specifically tuned for Social Network Analysis (SNA).
Key Takeaways:
- Focus on the Border: The center of a graph shouldn't just be the densest part; it should be the most interactive part.
- Structural Similarity: Using MDS for the border nodes ensures that the visualization isn't just about links, but about the roles nodes play in the network's global topology.
Limitations & Future Work
While effective for small to medium graphs (like the 107-node Twitter sample), the computational cost of MDS on the border set might scale poorly for massive networks. Future iterations could explore hierarchical border-node processing to handle the millions of interactions found in modern social platforms.