
Learners Thrive on Transparency: The Power of Multifaceted Open Social Learner Modeling
Learners Thrive Using Multifaceted Open Social Learner Modeling
This paper introduces a Multifaceted Open Social Learner Modeling (OSLM) approach implemented within the Topolor 2 system. It leverages social web techniques and gamification to visualize learner performance, contributions, and paths, achieving high levels of perceived effectiveness and satisfaction in university-level e-learning environments.
TL;DR
Static, isolated e-learning is dead. This paper presents Multifaceted OSLM, a framework that opens the "black box" of student data and transforms it into a social, competitive, and highly visual learning map. By integrating Facebook-like activity feeds and game-inspired progress tracking into the Topolor 2 system, the researchers proved that transparency significantly boosts student engagement, satisfaction, and perceived learning efficiency.
Background: Beyond the Black Box
In the traditional e-learning paradigm, the "Learner Model" is something the system maintains internally to provide recommendations. The student rarely sees it. However, the "Social Web Generation" (Gen Z and beyond) thrives on feedback loops, social validation, and competitive standing. The core insight of this paper is that exposing this model—making it "Open"—and adding "Social" layers allows students to engage in metacognition (reflecting on their own learning) and social constructivism (learning through peer interaction).
The Problem: The Granularity Gap
Prior attempts at Open Learner Modeling (OLM) faced two major hurdles:
- Complexity vs. Simplicity: Complex visualizations like large tree-maps (e.g., QuizMap) become unreadable as class sizes grow.
- Granularity: Many systems only show "completed" vs. "not completed," failing to capture the nuance of social contributions (comments, shared resources, forum help).
Methodology: Five Pillars of Visualization
The authors developed a multifaceted OSLM within the Topolor 2 system. The "multifaceted" nature means the system automatically adjusts what it shows based on where the learner is (e.g., viewing a specific topic vs. the whole course).
1. Performance & Comparison
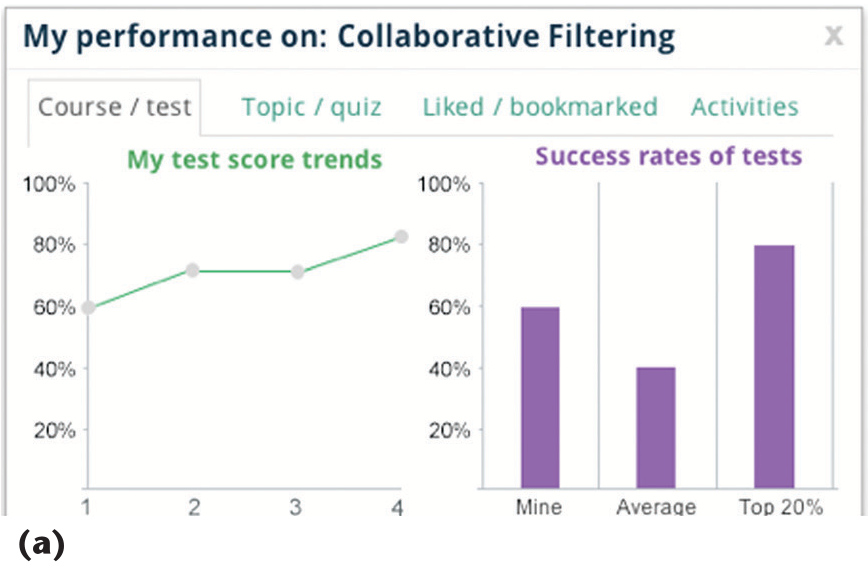
Instead of just a grade, students see their performance trends over time and compare them against the class average or the top 20% of achievers.
2. Social Contribution
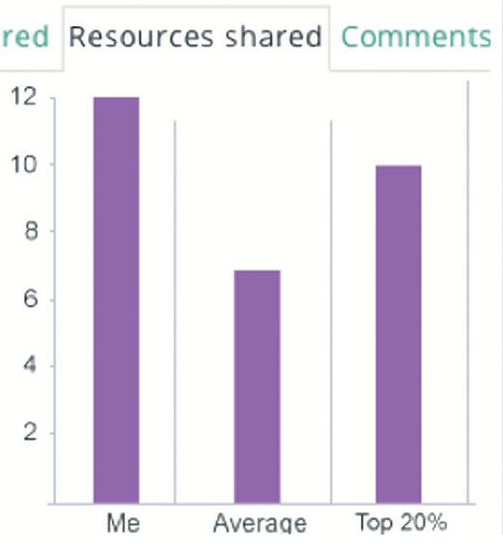
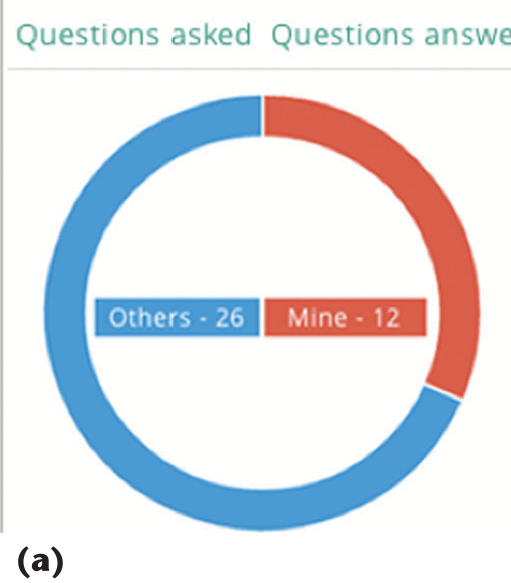
This acknowledges the learner as a "producer," not just a "consumer." It tracks and visualizes "likes" received, questions answered, and resources shared.
3. The "Vs" Mode (Gamification)
Inspired by online games, students can directly compare their profile with a peer's avatar, viewing relative standing in contributions and test scores.
4. Learning Path Tree
A hierarchical view that uses "locks" and "checkmarks" to provide a clear roadmap of prerequisites and "what to learn next."
5. Social Activity Feed
A waterfall list of activities (similar to a Facebook Wall) where students can "like" or comment on each other's progress.
Experiments & Results: Does it Work?
The researchers conducted two real-world trials at the University of Warwick (UK) and the Sarajevo School of Science and Technology (Bosnia).
Key Findings:
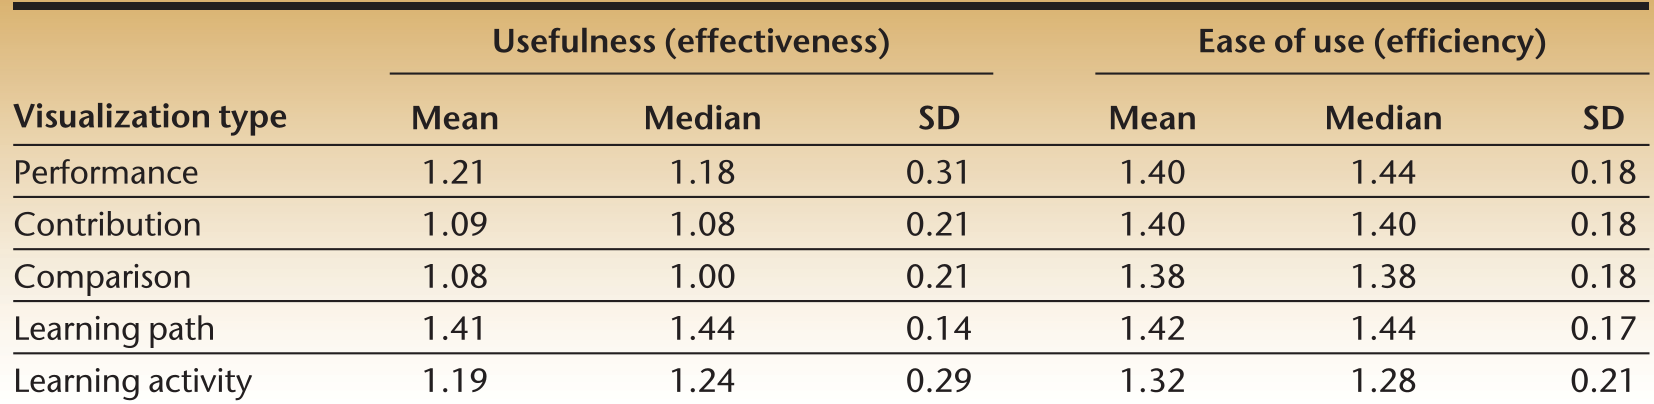
- Effectiveness: All features scored well above neutral, with the Learning Path (mean 1.56) being the most valued for reaching goals.
- Efficiency: The Social Activity Log received the highest score for ease of use (mean 1.76), proving that mimicking familiar social media UI reduces the learning curve for new software.
- Engagement: Statement S05, "Topolor increased my learning interests," received a massive mean score of 1.52, suggesting that OSLM significantly impacts student motivation.
Critical Insight: The "Expert User" Shortcut
One of the most profound takeaways is that the Facebook-like paradigm allowed students to become "expert users" of a complex academic tool almost instantly. This suggests that the future of EdTech UI isn't in creating new metaphors, but in successfully harvesting existing social ones to lower cognitive load.
Limitations & Future Work
- Privacy: While no students complained, the "Vs" mode raises potential ethical concerns regarding data disclosure.
- Mobile Adaption: Students using smartphones found navigation less intuitive, indicating a need for "Hardware-Aware" OSLM.
- Objective Outcomes: The study focused on perceived impact; future longitudinal studies are needed to prove that OSLM correlates directly with higher final exam scores.
Conclusion
This work demonstrates that when we stop hiding the "engine" of learner modeling and instead turn it into a social dashboard, students become more self-aware, competitive, and engaged. The multifaceted OSLM approach is a blueprint for the next generation of social, personalized adaptive learning systems.