
Beyond the Grade: How Social Networks Catalyze Collaborative Learning
Learning and Social Networks - Similarities, Differences and Impact
This study utilizes Social Network Analysis (SNA) and Exponential Random Graph Models (ERGM) to compare "learning" and "social" networks within a blended higher education course. It identifies that while social ties act as a catalyst for academic interaction, only centrality within the learning network directly correlates with improved student performance.
TL;DR
Is a "social" student a "successful" student? This study dives deep into the dual nature of student interactions, revealing that while being socially active doesn't directly raise your grades, it serves as a powerful catalyst. Having a social connection makes you nearly 5 times more likely to collaborate academically, which does drive performance.
Problem & Motivation: The "Social" vs. "Learning" Blind Spot
In the world of Computer-Supported Collaborative Learning (CSCL), we often treat all "interactions" the same. However, a student posting about a weekend party is engaging in a fundamentally different cognitive process than a student debating a clinical diagnosis.
The authors identified a gap: previous work either focused on qualitative content analysis (which is too slow for large courses) or generic SNA metrics that didn't distinguish between the social motive and the learning motive. The researchers sought to understand the "Why" and "How" behind these two parallel networks.
Methodology: Mapping the Student Graph
The study was conducted in a blended surgery course using two distinct Moodle forums. One was purely for clinical case discussions (Learning Network), and the other for social events and non-course help (Social Network).
1. The Toolkit
- QAP (Quadratic Assignment Procedure): Used to correlate the two networks without violating the statistical assumption of independence (since social data points are inherently linked).
- ERGM (Exponential Random Graph Models): These were used to predict why a tie forms. Is it because the teacher is involved? Or because a student is already "popular" (Indegree)?
2. Network Visualizations
The study included a critical visualization of how these networks differ in density and structure.
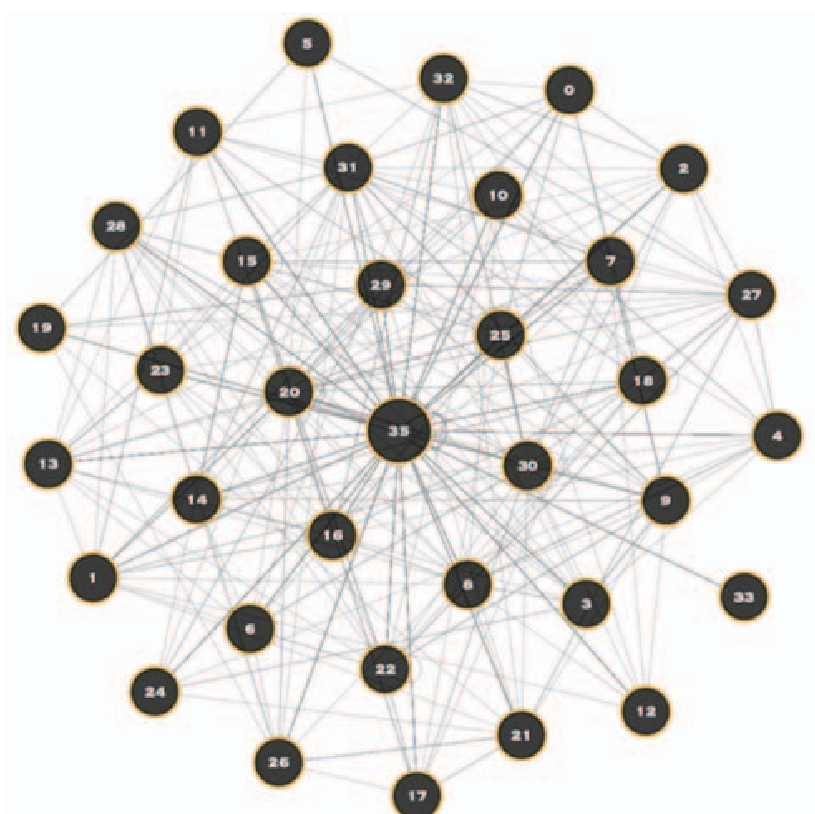 Note: The learning network (right) is significantly denser, showing more intensive interaction compared to the sparser social network (left).
Experiments & Results: Selective Learning vs. Reciprocal Socializing
The findings revealed a fascinating dichotomy in student behavior:
- The Catalyst Effect: A social tie raised the odds of an academic tie by 4.6 times. Socializing lowers the "activation energy" required for students to collaborate on complex learning tasks.
- Selectivity in Learning: The learning network showed lower reciprocity than the social network. Students were "picky" about who they replied to when the stakes were academic, likely gravitating toward peers with perceived higher ability or "stars" in the field.
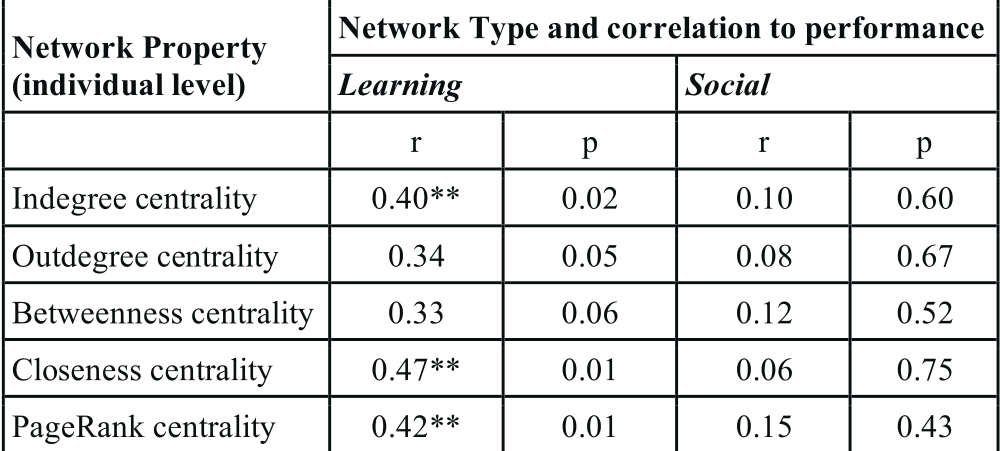
- The Grade Connection: In the Learning Network, high PageRank and Closeness Centrality were strong predictors of performance. If you were well-connected to other high-performers, your grades reflected that.
Performance Correlation Table
The following table highlights that only learning-related centrality measures translate into academic success.
Critical Insight & Conclusion
The main takeaway of this research is that Social Networks fuel the engine, but Learning Networks steer the ship.
The Two Growth Engines:
- Learning Networks grow through "Preferential Attachment": Students follow the leaders and academic high-achievers.
- Social Networks grow through "Reciprocity": I reply to you because you replied to me—it's about building Rapport.
Limitations & Future Work
The study was conducted on a relatively small cohort (n=35). Future research should apply these ERGM models to thousands of students in MOOCs to see if the "Catalyst Effect" holds at scale. Furthermore, the role of the teacher (User 35 in the graph) as a central bridge could be further explored to see if teacher intervention effectively "seeds" social networks in isolation.
Takeaway for Educators: Don't ban the "off-topic" social forum. It is the foundation upon which the productive learning network is built.