
Dissecting PRIME: Unveiling the Hidden Performance Variables in Smart Metering Networks
Let there be light: dissecting how PRIME networks work based on actual traffic traces
This paper presents a forensic dissection of actual traffic traces from a multi-vendor PRIME (Powerline Intelligent Metering Evolution) network. By utilizing a custom-built traffic analyzer on data from the Network Integration Laboratory (LINTER), it investigates how vendor-specific implementations affect narrowband power line communication (NB-PLC) performance.
TL;DR
The success of the Smart Grid relies on Advanced Metering Infrastructure (AMI), yet the "black box" implementations of communication standards by different vendors often lead to unpredictable performance. This paper dissects actual traffic traces from a multi-vendor PRIME network to reveal how manufacturer-specific choices in MTU and Window Size create significant variations in data retrieval efficiency.
Background: The Wild West of NB-PLC
Narrowband Power Line Communication (NB-PLC) is the backbone of modern smart meters. Among various standards, PRIME (PoweRline Intelligent Metering Evolution) has gained massive traction. However, the PRIME specification allows manufacturers significant freedom. This research asks the critical question: Does this freedom lead to optimal performance, or does it create a fragmented and inefficient network?
Methodology: Peering into the Powerline
The authors utilized the Network Integration Laboratory (LINTER), a sophisticated testbed featuring equipment from 9 different vendors (e.g., SAGEMCOM, ZIV, STMicroelectronics).
The core of the methodology involves a custom traffic analyzer that maps the relationship between:
- PRIME MAC Layer: Handling fragmentation and ARQ (Automatic Repeat Request).
- DLMS/COSEM Application Layer: The standard language for energy data representation.
The researchers focused on the Time To Read (TTR)—specifically the time required to pull a 24-hour "S02" consumption report. This is a vital KPI for Distribution System Operators (DSOs) who need to ensure millions of meters are read within strict windows.
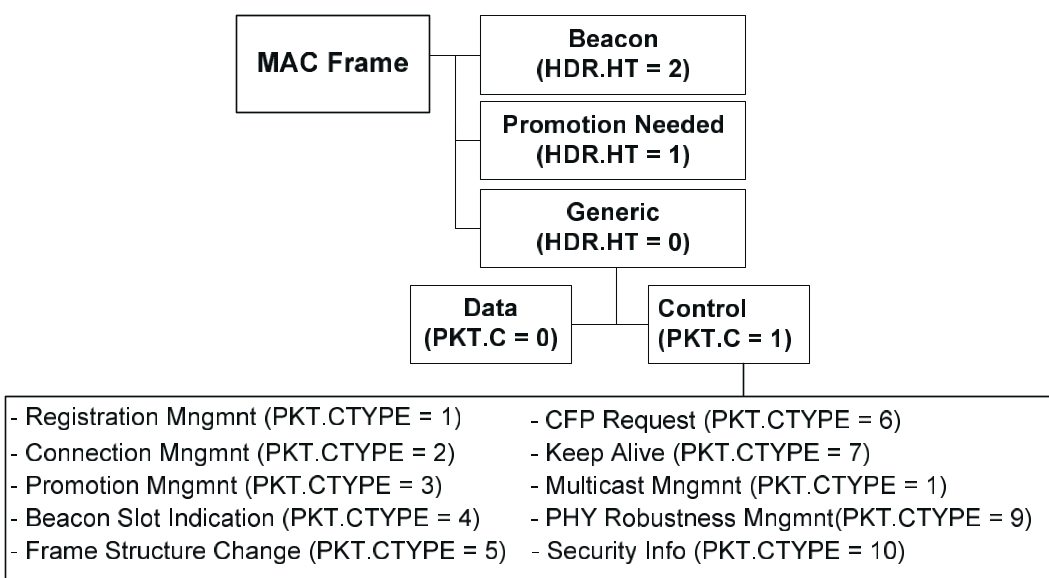 Figure 1: The complexity of PRIME MAC frames where vendor-specific headers can drastically change effective throughput.
Key Findings: The Heterogeneity Gap
The analysis revealed a surprising lack of uniformity. While the PRIME standard allows for a Maximum Transmission Unit (MTU) of 256 bytes, the traces showed that most manufacturers default to much smaller sizes, often between 47 and 67 bytes.
The Effective Window Size (WS)
Communication efficiency is heavily governed by the Window Size—the number of frames sent before requiring an acknowledgment. The authors derived a formula for the Effective Window Size ():
eg FLUSH) + 1$$ They found 13 different combinations of WS and MTU across the network, suggesting that "optimum configuration" is still an open challenge for the industry. 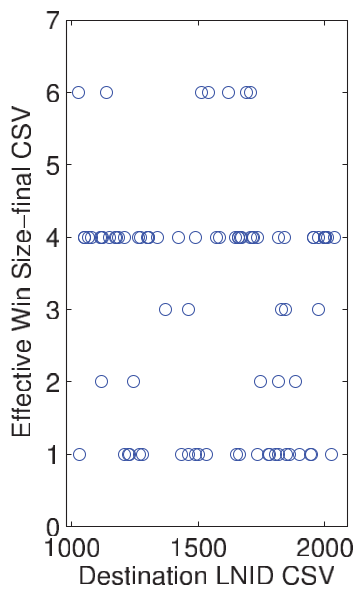 *Figure 2: Distribution of Window Size and MTU across different Local Node IDs (LNID), highlighting implementation diversity.* ## Performance Modeling with Erlang Distribution One of the paper's most significant academic contributions is the modeling of TTR. By plotting the time taken to read meters, the authors demonstrated that communication latency in these networks follows an **Erlang distribution**. $$p(x) = L^2 x e^{-Lx}$$ This mathematical grounding allows DSOs to move beyond "best-case scenario" simulations and move toward high-fidelity models that account for the reality of multi-vendor environments and the harsh physical layer of low-voltage cables. 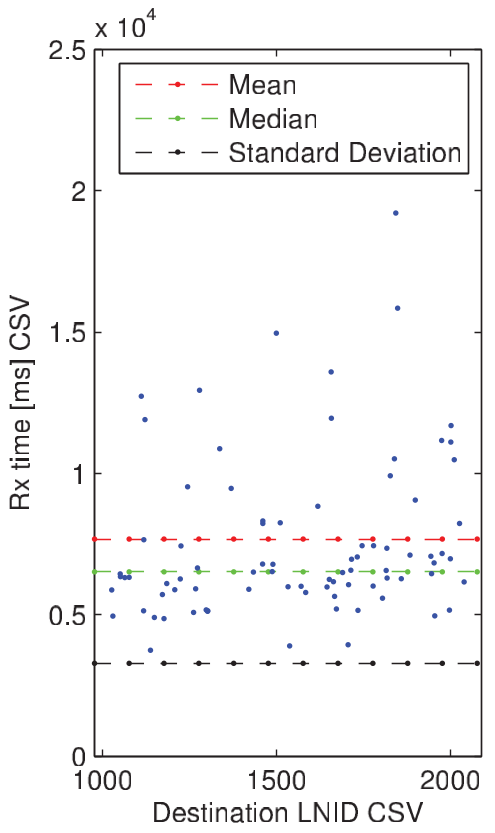 *Figure 3: TTR Analysis showing the Erlang-like distribution of reading times across the network.* ## Critical Insight & Future Outlook The paper proves that the "intelligence" in Powerline Intelligent Metering Evolution is currently constrained by conservative manufacturer settings. By applying **k-Nearest Neighbors (k-NN)** clustering, the authors suggest that DSOs can categorize these heterogeneous behaviors to simplify network management. **Takeaway for the Industry**: As we move toward PRIME v1.4 (supporting higher bands up to 1028.8 kbps), the industry must standardize not just the protocol, but also the *profiling* of these configuration parameters. Without better alignment on MTU and ARQ strategies, the jump in theoretical speed will be bottlenecked by inefficient implementation choices at the firmware level. ## Conclusion This study provides a rare, transparent look at the operational reality of Smart Grids. It bridges the gap between theoretical standards and actual field performance, providing DSOs with the forensic tools needed to diagnose "dark" spots in their lighting networks.