
The Power of Projection: Optimizing P2P Systems via Social Centrality
Leveraging Peer Centrality in the Designof Socially-Informed Peer-to-Peer Systems
The paper introduces the Projection Graph (PG) model to analyze peer-to-peer (P2P) systems hosting decentralized social graphs. By leveraging peer centrality metrics (Degree and Betweenness), the authors achieve significant performance gains in social search and P2P overlay organization.
TL;DR
This paper bridges the gap between social network analysis and distributed systems by introducing the Projection Graph (PG). By mapping users' social ties onto the peers that host them, the authors demonstrate that we can vastly improve P2P search efficiency (up to 5x less overhead) simply by being "socially informed" about which peers act as hubs in the network.
Problem & Motivation: The Structural Mismatch
In the current era of data decentralization, social graphs are often scattered across thousands of user-contributed devices. However, most P2P architectures use Distributed Hash Tables (DHTs) for data placement, which optimizes for load balancing but completely ignores the "social flow" of information.
When an application tries to perform a Social Search (e.g., looking for a friend-of-a-friend with a specific gaming skill), the search query must "jump" between peers. If the P2P overlay doesn't align with the Social Graph (SG), these jumps become expensive, slow, and prone to failure. The authors’ core insight is that peer centrality in the P2P layer is a direct reflection of user centrality in the social layer, and we can exploit this to build smarter networks.
Methodology: What is a Projection Graph?
The Projection Graph is a formal bridge between two layers:
- Social Graph (SG): Users and their personal relationships.
- P2P Overlay: The physical network of servers/peers.
A PG edge exists between two peers if any of the users they host share a social connection. The "weight" of that edge is the total number of such connections.
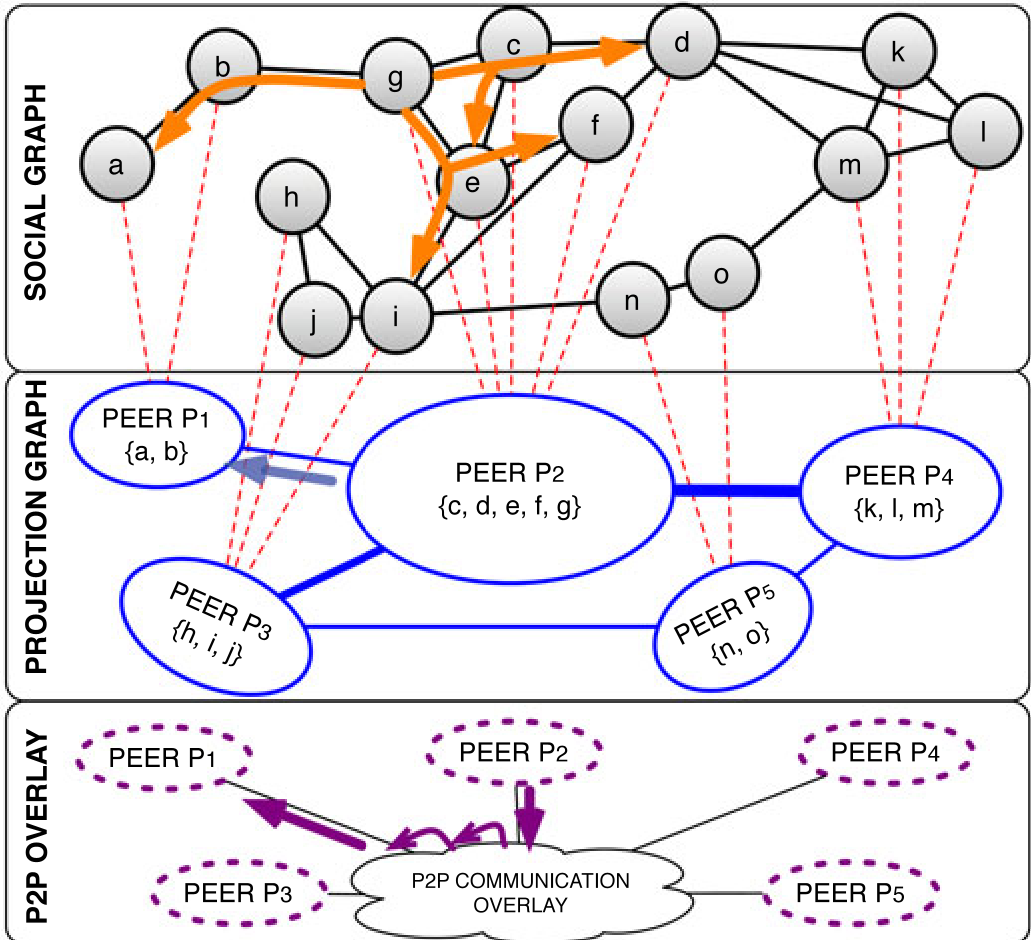 Figure 1: The three-layer model—Social Graph, Projection Graph, and P2P Overlay.
Centrality Metrics
The authors focus on three classical metrics adapted for the PG:
- Degree Centrality (DC): How many "neighboring peers" a node can reach directly.
- Node Betweenness (NB): How often a peer acts as a bridge for the shortest paths between others.
- Edge Betweenness (EB): Identifying critical social "vines" connecting separate communities.
The mathematical challenge solved here is defining how to estimate these peer-level metrics using only high-level summary data from users (essential for privacy when you can't see a user's entire friend list).
Experiments & SOTA Comparisons
The paper evaluates these theories using real-world data from Slashdot and Steam (comprising 12.5M players).
1. Social Search Efficiency
In a "Team Builder" scenario, the goal was to find a diverse set of players across different communities. The PG-informed search (targeting top-DC peers) outperformed random search dramatically.
- Success Rate: Centrality-based techniques reached 90% success within 4 hops, while random techniques lagged at 40%.
- Overhead: System overhead was slashed by up to 5x.
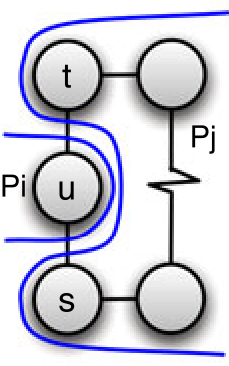 Figure 2: Performance comparison showing PG-informed search reaching higher success rates faster than random baselines.
2. P2P Overlay Design
By creating "Active Links" in the P2P overlay that mimic high-centrality PG edges, the system becomes naturally resilient. It focuses resources on the peers that are most likely to handle social traffic.
Critical Analysis & Takeaways
Why it works
The effectiveness stems from the correlation between User and Peer centrality. When 50–150 users are mapped to a peer, that peer "inherits" the social importance of its residents. This allows for local decision-making (knowing your own users) to yield global optimization (efficient network routing).
Limitations
- Churn: P2P systems are volatile. While the Social Graph is stable, peers go offline frequently. The paper acknowledges this but relies on social stability to mitigate overlay rewiring.
- Privacy: Calculating high-order metrics like Betweenness requires global knowledge, which is difficult in a truly decentralized system without sensitive data exposure.
Future Outlook
This work paves the way for "Socially-Aware" clouds. Imagine a decentralized version of Facebook or LinkedIn where your data resides on a "socially close" server, ensuring that your interactions are fast, private, and efficient without a central authority. The Projection Graph is the mathematical blueprint for that future.
Summary (Takeaway)
The paper proves that a P2P system doesn't have to be a blind data store. By "projecting" social intelligence onto the network layer, we can build decentralized applications that are just as fast as centralized ones but significantly more robust and user-controlled.