
Monitoring Power: Leveraging Graph Data to Map India's Corporate-Government Interlocks
Leveraging Web Data to Monitor Changes in Corporate-Government Interlocks in India
The paper presents a technology platform designed to monitor corporate-government interlocks in India by integrating structured web data with unstructured news media. Using a Neo4j-based social network graph of over 200,000 entities, the authors develop an empirical indicator to track the strengthening of these influential power structures over time.
TL;DR
Researchers from IIT Delhi have built a first-of-its-kind platform to track the "revolving door" between the Indian government and corporate boardrooms. By mapping over 200,000 entities—including politicians, bureaucrats, and firms—into a massive graph, they’ve proven that the interlock between power and capital in India has strengthened significantly over the last decade, primarily through retired officials entering the private sector.
Background: The Price of Inequality
Corporate-government interlocks occur when executives have ties to politicians or when public officials have stakes in corporate organizations. While not always illegal, these networks often create a fertile ground for cronyism—the preferential treatment of associates regardless of qualification. This leads to policy manipulation and inequitable resource distribution. Historically, tracking these ties was the domain of manual investigative journalism; this paper transitions that task into the realm of Automated Data Science.
The Challenge: Connecting the Dots across Fragmented Data
The authors identified three primary pain points:
- Data Fragmentation: Information is scattered across diverse, often "hostile" sources like interactive web queries, PDFs, and unstructured news articles.
- Entity Resolution (ER): Names like "A. Singh" are ubiquitous. Distinguishing whether a specific "Singh" in a news article is the same one on a corporate board requires sophisticated context-aware matching.
- Linkage Dynamics: Power isn't just about direct ties; it’s about multi-hop influence (e.g., a politician's relative who sits on the board of a firm's subsidiary).
Methodology: The Power-Graph Architecture
The system's backbone is a Neo4j Graph Database, which stores entities as nodes and relationships (e.g., belongs_to, works_in, related_to) as edges.
1. The Recursive PageRank Scoring
To go beyond simple counting, the authors adapted the PageRank algorithm. Instead of just ranking web pages, they rank bureaucrats and politicians based on their "connectedness" to powerful companies.
- The Logic: A bureaucrat’s score increases if they are connected to a company with high authorized capital, or to other highly-ranked bureaucrats.
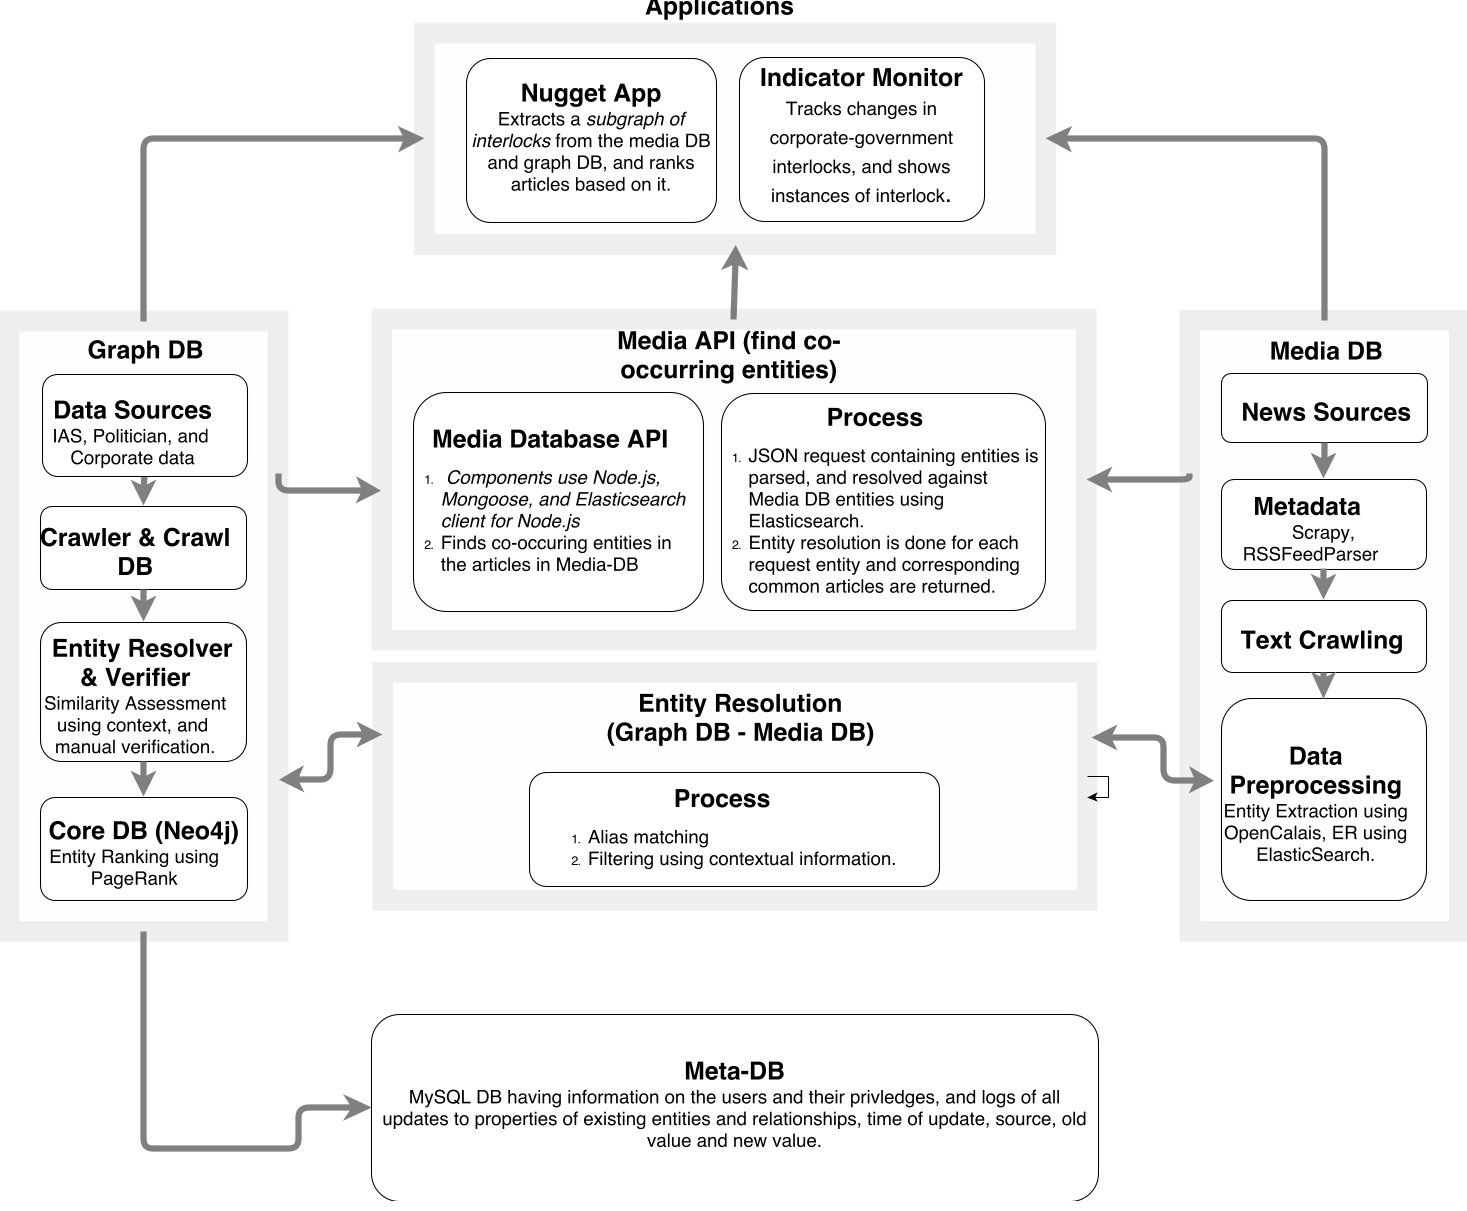 Figure 1: The system architecture showing the flow from web crawling to entity resolution and final application layers.
2. The Indicator of Interlock ()
The researchers defined a national indicator to measure the "overlap" between sectors: This formula essentially weights the "bridge" edges between the government and corporate nodes by the influence (PageRank) of both endpoints.
Key Insights: A Strengthening Bond
The platform's longitudinal analysis (2004–2018) yielded several striking findings:
- Monotonic Increase: The interlock index has risen steadily across three general election cycles.
- The Retirement Bridge: The surge is largely credited to retired IAS (Indian Administrative Service) officers taking up directorships.
- Corporate Concentration: The network within the corporate sector is becoming denser. While the number of subsidiaries isn't exploding, the number of shared directors among top-tier firms is increasing, creating a tightly-knit "Power Elite."
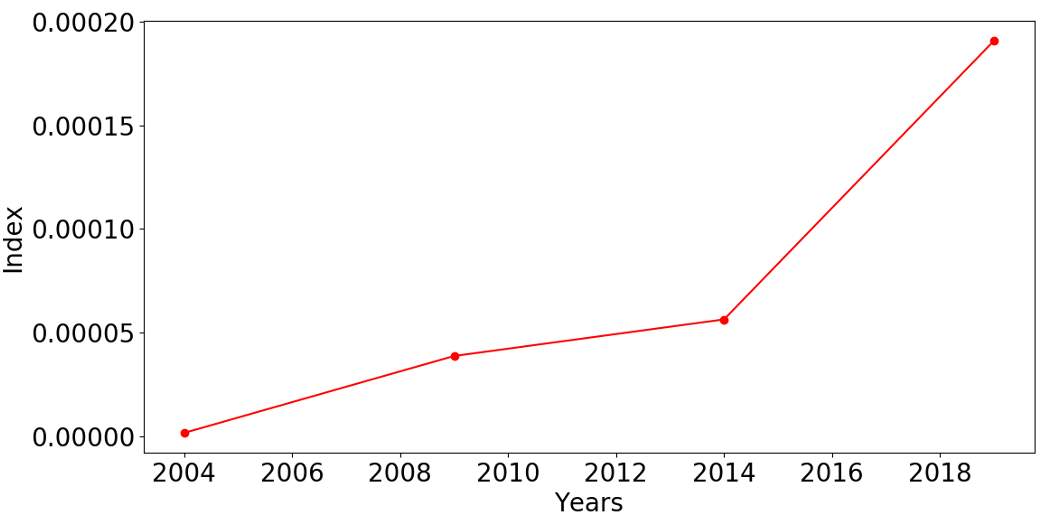 Figure 2: The monotonic increase of corporate-government overlap in India from 2004 to the present.
Real-World Application: The 2G Scam Case Study
The "News Nugget" application demonstrates the platform's utility for journalists. By inputting a query like "2G Scam," the tool generates a subgraph showing how the accused politicians and telecom executives were linked through "hidden" nodes (intermediary companies or relatives) not mentioned in the original news reports.
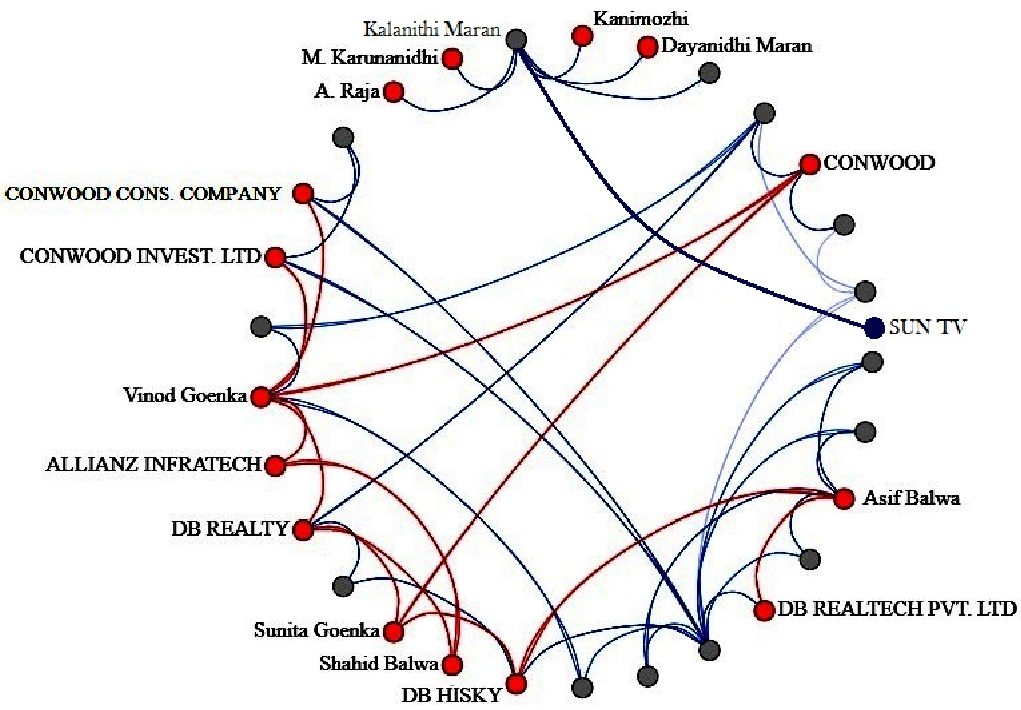 Figure 3: A subgraph identifying latent connections in the 2G Telecom Scam, uncovering relationships that avoided media detection.
Conclusion and Future Outlook
This work marks a significant step in Computational Social Science. By turning the "web of power" into a queryable graph, the authors provide a tool for accountability. The authors' future plans to include crowdsourcing and sentiment analysis of political views suggest the platform could soon track not just who knows whom, but who thinks alike, further exposing structural alignments in the political economy.
Limitations: The study currently lacks complete timestamp data for all edges, making it hard to always determine the "direction" of the tie (did the politician join the board, or did the director enter politics?). However, as a framework for transparency, its value to democracy is indisputable.