
Navigating the Chaos: Limit Cycles and Velocity History in Mazda’s Keiretsu
17928_An analysis of limit cycle and velocity history in Mazda's keiretsu.
This paper applies Limit Cycle Theory and Velocity History to analyze the organizational behavior of Mazda's "Kansai Yokokai" supplier network. By mapping sales and profit fluctuations into nonlinear phase spaces, the authors categorize 23 firms into four distinct patterns ranging from stable equilibrium to high-order chaos.
TL;DR
This research moves beyond linear financial forecasting to treat corporate behavior as a dynamical system. By analyzing Mazda's supplier network (Kensai Yokokai), the authors demonstrate that a firm’s financial path—plotted as a Limit Cycle—reveals hidden patterns of stability or "chaos." The study finds that a company's scale and its independence from parent entities directly determine whether its performance is a simple wave or a complex, chaotic attractor.
Problem & Motivation: The Limits of Linearity
In the realm of strategic management, we often assume that organizations behave in predictable, linear ways. However, the "Keiretsu" system—Japan’s unique web of interlocking business relationships—is far from linear.
The authors argue that traditional statistics miss the "pulse" of a company. Drawing inspiration from Chaos Theory (applied in hydrology and cardiology), they suggest that organizations have a "heartbeat" manifested in their financial cycles. The core challenge is: How can we visually capture the deterministic yet unpredictable behavior of firms within an organized network?
Methodology: Mapping the Organizational Heartbeat
The researchers propose a 6-step workflow to transform raw financial data into a phase-space visualization:
- Variable Selection: Using related metrics like Sales and Profit.
- Marginal Values: Calculating the change between periods ().
- Difference Scores: Subtraction of the mean marginal value to center the data.
- Velocity (): Multiplying the centered scores of two variables to determine the "speed" of organizational change.
- Trajectory Plotting: Creating the Limit Cycle (Phase Plot) and Velocity History.
The Four Patterns of Chaos
The paper utilizes the Priesmeyer framework to categorize companies based on their visual "Attractors":
- Period 1: A singular dot (Consistent performance).
- Period 2: A straight line (Regular oscillation).
- Period 4: A "Butterfly" pattern (Complex but regular).
- Period 8: High-order chaos (Turbulent, unpredictable pattern).
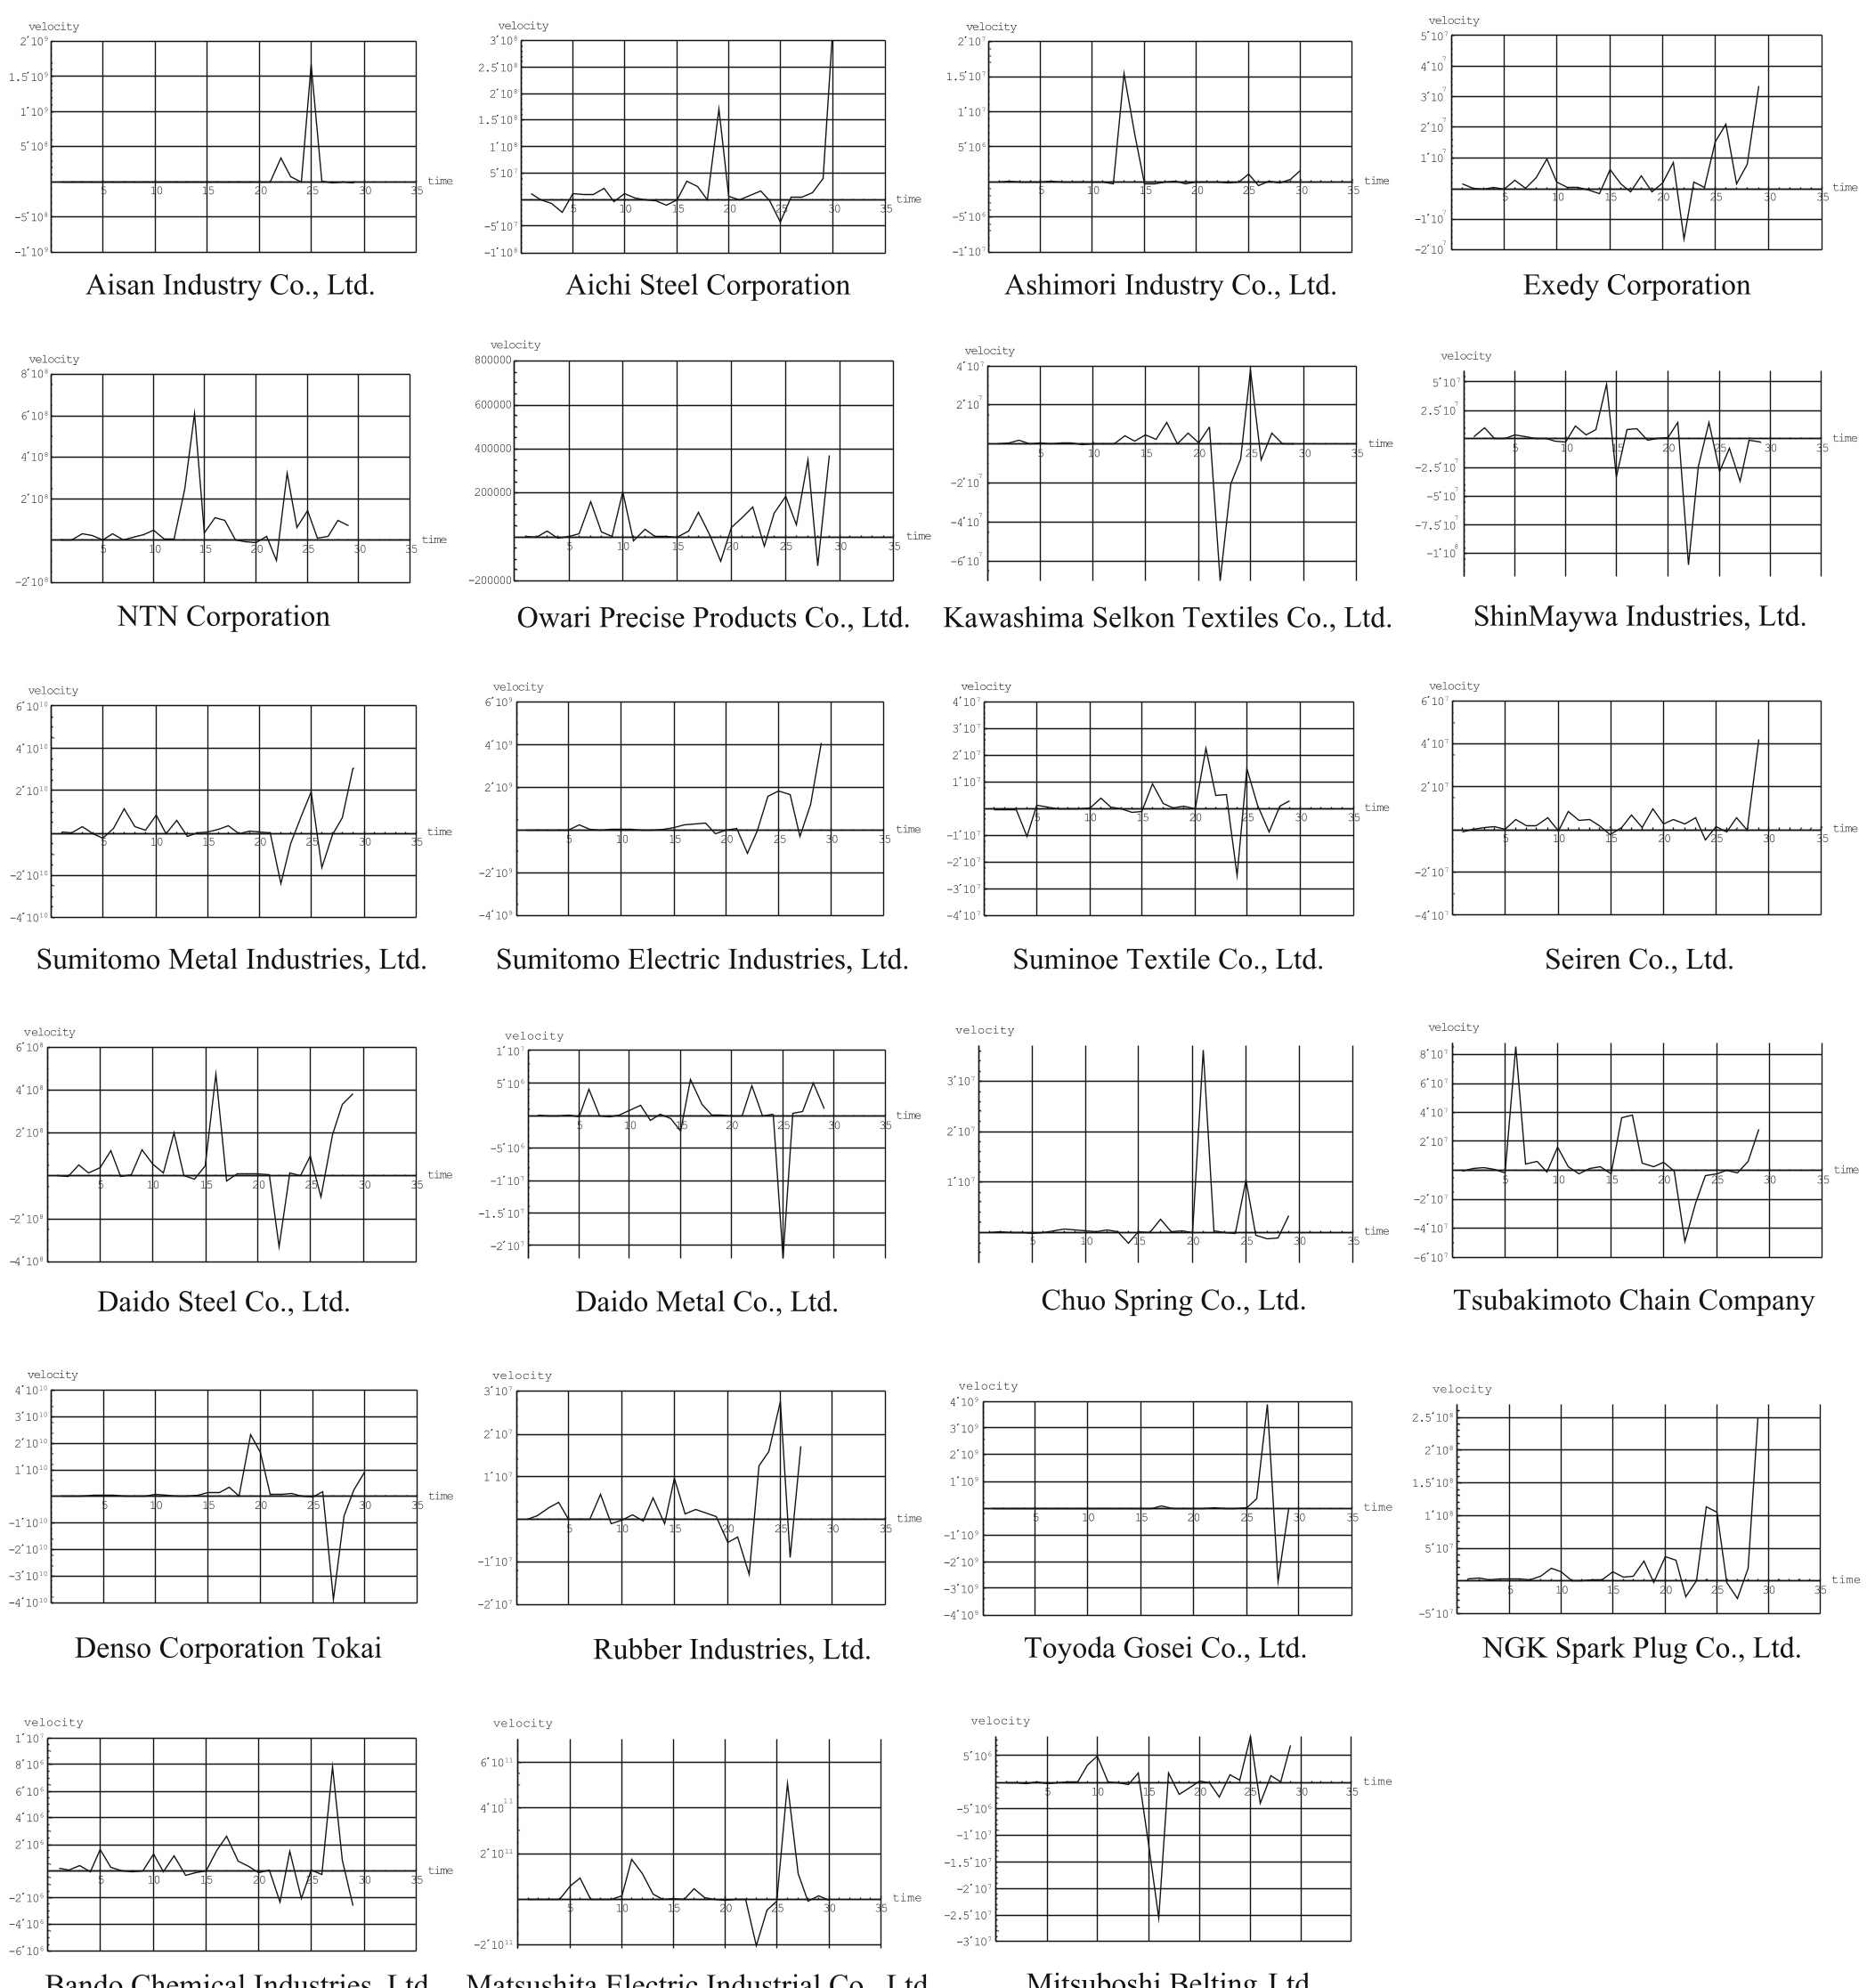 Figure 1: The categorical limit cycle patterns used to classify Mazda's suppliers.
Experiments & Discussion: Scale vs. Independence
The authors analyzed 23 firms in the Kansai Yokokai (Mazda's supplier group). The results revealed a fascinating split:
| Pattern | Examples | Characteristics |
|---|---|---|
| Period 2 | Sumitomo Electric, NTN Corp | Linear, predictable performance oscillations. |
| Period 4 | Aisan Industry, Chuo Spring | Balanced, "Butterfly" cycles; typical of direct subsidiaries. |
| Period 8 | Denso, Matsushita (Panasonic) | High-order chaos; massive scale; independent of a single buyer. |
Deep Insight: The "Denso vs. Aisan" Case
The comparison between Denso and Aisan Industry (both Toyota-related suppliers to Mazda) is pivotal.
- Aisan (Period 4): Smaller scale, highly dependent on the parent company. Its behavior is "tethered" and more regular.
- Denso (Period 8): Giant scale, multi-client base. Because it interacts with Mazda, Toyota, Honda, and Suzuki, its internal dynamics are buffeted by multiple external environments, resulting in a chaotic limit cycle.
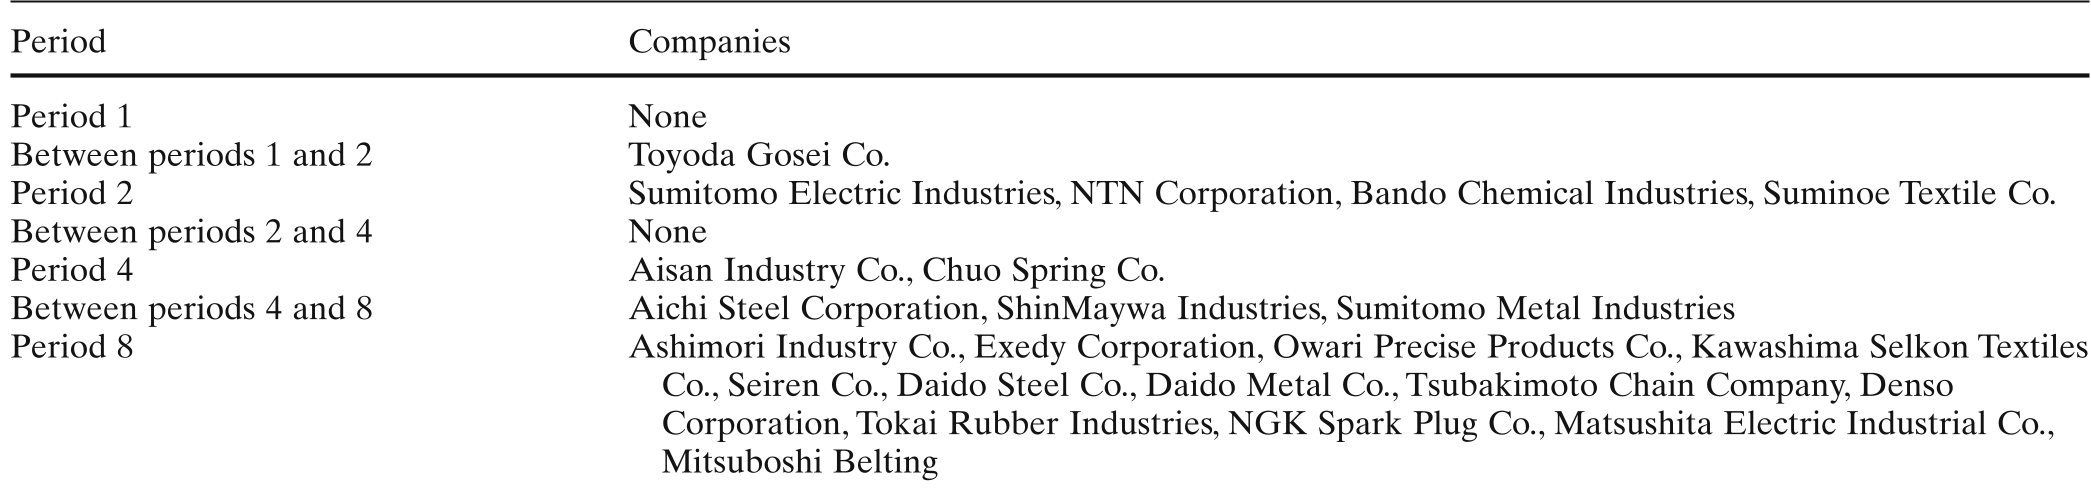 Figure 2: Classification of firms within the Kansai Yokokai based on observed periodicity.
Critical Analysis & Conclusion
The value of this study lies in its Visual Intuition. Instead of staring at spreadsheets, managers can look at a "Butterfly" or "Chaotic" plot to immediately sense the structural stability of a supplier.
Takeaways:
- Scale breeds Chaos: As firms grow and diversify their client base (like Denso), their performance naturally shifts toward high-order chaos.
- Strategic Diagnostic: Limit cycles can identify when a firm is moving from a stable "Period 2" into a more turbulent "Period 4," serving as an early warning system.
Limitations: The authors admit a significant hurdle: Period 8 is a "black box." In high-order chaos, it is difficult to distinguish between healthy market-driven complexity and genuine organizational failure. Future research must develop finer indices to "de-noise" Period 8 trajectories.
Ultimately, this paper serves as a bridge between hard physics/math and the "soft" science of organizational management, proving that even in a structured Keiretsu, chaos is the norm for the most successful players.