
Beyond the Clustering Coefficient: Dissecting Social Networks via WSD3
Identifying Local Clustering Structures of Evolving Social Networks Using Graph Spectra (Short Paper)
This paper investigates the Weighted Spectral Distribution with 3-cycles (WSD3) as a metric for identifying local clustering structures in evolving social networks. By analyzing normalized Laplacian spectra, the authors demonstrate that the ratio WSD3/n serves as a size-independent, highly sensitive alternative to the traditional clustering coefficient.
TL;DR
While the Clustering Coefficient is the "go-to" metric for social network analysis, it often loses its edge when dealing with evolving networks of varying sizes. This paper proposes the Weighted Spectral Distribution with 3-cycles (WSD3). By leveraging the normalized Laplacian spectrum, the authors provide a size-independent metric () that is more sensitive to local structures and reveals fundamental differences between social and communication topologies.
The Core Motivation: Why "High Clustering" Isn't Enough
In the study of small-world networks, we typically look for low path lengths and high clustering coefficients. However, the standard clustering coefficient () is somewhat "blind"—it treats all links in a triangle equally. In reality, a connection between two "influencer" nodes (high degree) carries different structural weight than a connection between two "leaf" nodes.
The authors argue that we need a metric that:
- Incorporates node degree information within the local triangle structure.
- Scales predictably as the network grows (size-independence).
Methodology: The Math of Cycles
The study centers on the normalized Laplacian matrix . The eigenvalues () of this matrix are restricted between 0 and 2. The for -cycles is defined as:
For (triangles), this converts to a sum over all 3-cycles:
This specific formulation is the "Secret Sauce": unlike the standard clustering coefficient, considers the product of the degrees of all nodes in the triangle. This makes it significantly more sensitive to the actual connectivity density and importance of the nodes involved.
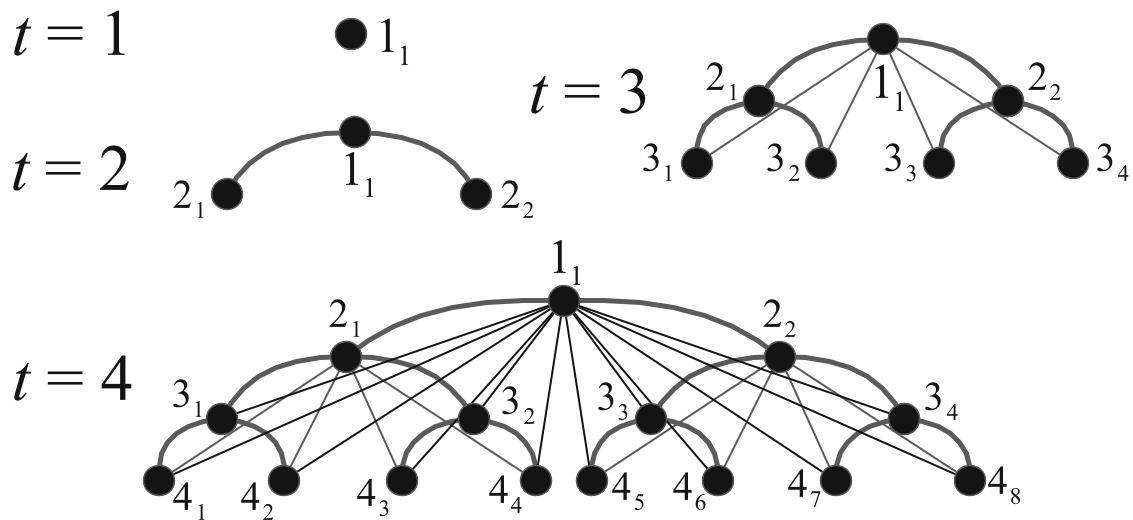 Fig 1: The 3-cycle pattern (Triangle) analyzed for local structure.
Key Findings: Social vs. Communication Networks
One of the most profound insights of this paper is the comparison between Social Networks and Communication Networks (like the Internet).
- Social Networks: The spectral density of the normalized Laplacian is asymmetric. As the network grows, grows sublinearly, making a positive constant.
- Communication Networks: The spectral density is quasi-symmetric around 1. Because for values above 1 cancels out values below 1, the effectively stays near zero regardless of network size.
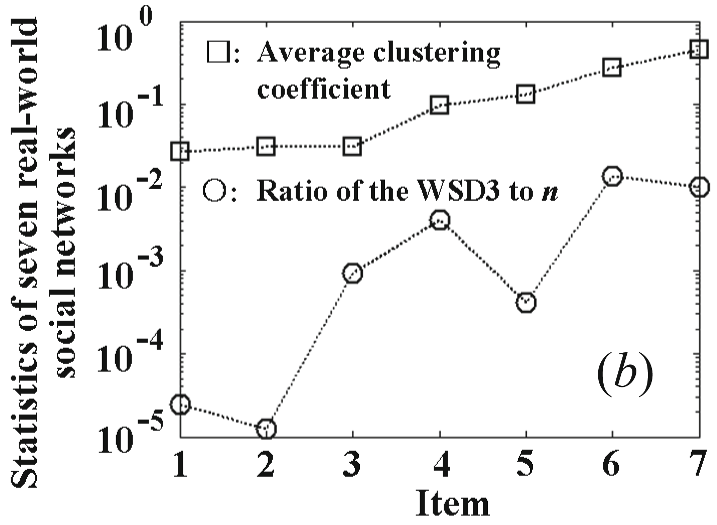 Fig 2: (a) Stability of WSD3/n in evolving models. (b) Sensitivity of WSD3/n across real-world datasets like Facebook and Enron.
Conclusion and Future Outlook
The paper successfully elevates from a theoretical concept to a practical tool for network science. By proving that social networks possess a unique "asymmetric signature" in their spectrum, the authors have provided a new way to fingerprint and compare large-scale evolving systems.
Takeaway: If you are analyzing a network where the relative importance (degree) of connected neighbors matters, stop relying solely on . The spectral distribution offers a deeper, more discriminative look at the local clustering "DNA" of your graph.
Limitations: As a short paper, it focuses primarily on 3-cycles. Future work could explore whether (quadrangles) or higher-order cycles provide even deeper insights into community "motifs" within complex social hierarchies.