
Social Sensors: Turning Twitter into a Global IoT Network for Obesity Surveillance
Local spatial obesity analysis and estimation using online social network sensors
This paper introduces an obesity identification and estimation model that treats Online Social Network (OSN) users as "social sensors" within an IoT-enabled framework. By extracting behavioral features from Twitter data across 110 US cities, the study achieves high-accuracy local spatial obesity rate estimation through a dynamic epidemic-inspired model.
TL;DR
Researchers have developed a method to estimate local obesity rates by treating social media users as "digital sensors." By analyzing dietary habits, stress levels, and "self-consciousness" expressed on Twitter, the proposed model can estimate regional obesity levels with a margin of error under 1-2% for the majority of US states, outperforming traditional physical sensor-based IoT approaches in cost and scale.
Academic Positioning: This work bridges the gap between Internet of Things (IoT) and Public Health Informatics, transforming OSNs (Online Social Networks) from communication platforms into massive, distributed sensing infrastructures for chronic disease tracking.
The Problem: The Invisibility of Chronic Trends
Public health agencies like the CDC usually rely on lagging indicators: surveys and hospital records. While effective for acute outbreaks like the flu, these methods struggle with obesity—a chronic condition driven by "invisible" daily behaviors (what you eat, how you feel, your desire to change).
The authors argue that traditional IoT solutions—which might require wearable sensors for millions—are impractical. Instead, they propose that users "report" their status through every tweet, acting as Social Sensors.
Methodology: Quantifying the Digital Self
The core of the paper lies in its feature extraction pipeline. The researchers didn't just look for the word "obese." They quantified physical and psychological markers:
- Dietary Habit: Measuring the density of mentions of high-calorie foods (via USDA Nutrient Database) and Top 10 Fast Food chains, normalized by estimated local user population.
- Emotion Features: Using sentiment analysis to track stress, pressure, and depression—medical precursors to weight gain.
- Self-consciousness: Identifying "intent to lose weight" as a feedback loop.
The Obesity Dynamic Model
The study adapts an epidemic model to a chronic context: Where the variation coefficient is not a constant but a dynamic variable derived from social media features using multiple linear regression:
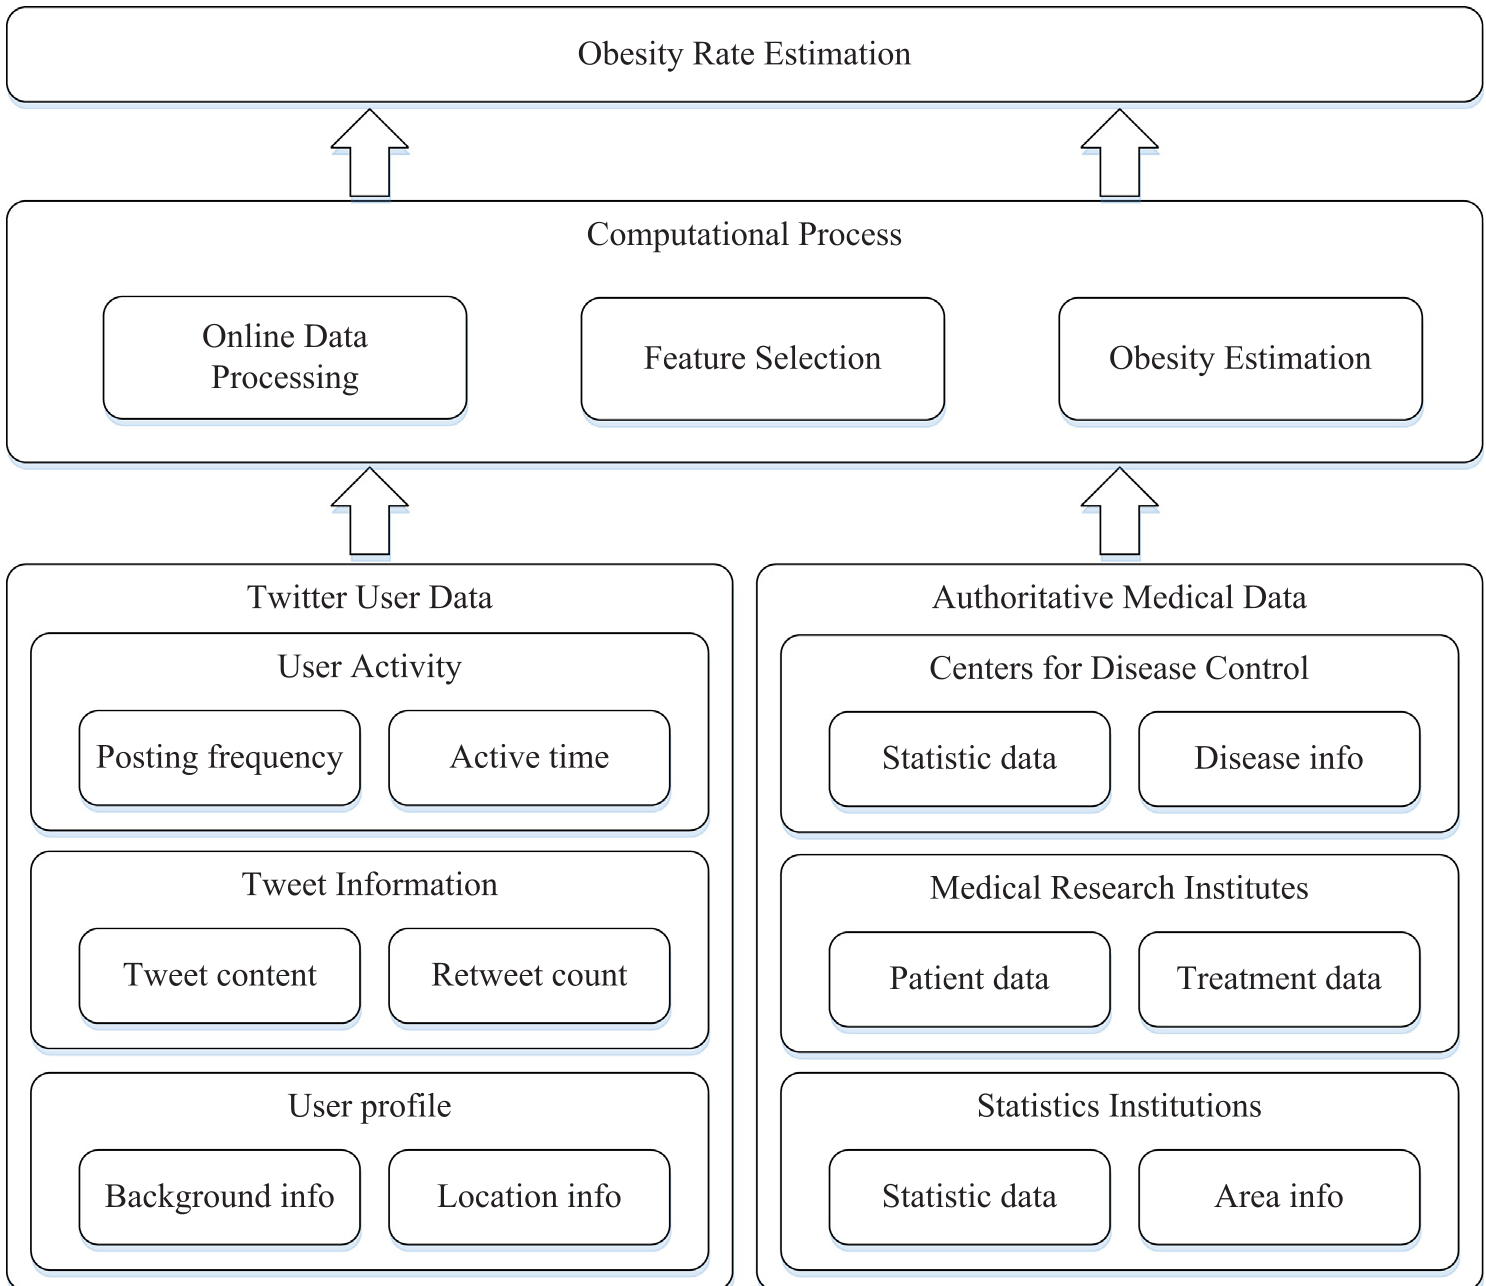 Figure 1: The dual-stage framework involving data collection from social sensors and authoritative medical sources.
Experimental Insights: Food vs. Gym
One of the most striking findings was the decoupling of sports and obesity in social media metadata.
- The Food Correlation: High-calorie food density showed a strong positive correlation (0.548) with obesity.
- The Sports Paradox: Mentions of professional sports (Basketball, Football) had almost zero correlation (0.146) with local obesity rates.
The Intuition: People love to talk about sports regardless of their physical condition, whereas dietary mentions are more indicative of actual consumption habits.
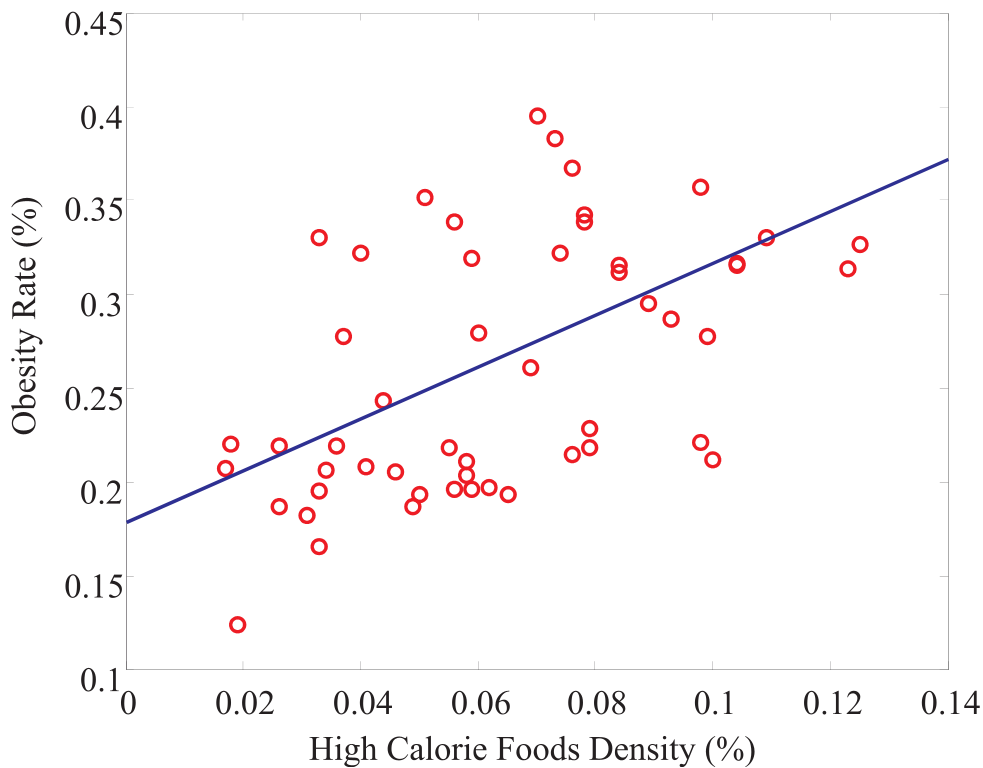 Figure 2: Scatter plot demonstrating the direct relationship between high-calorie food sentiment and local obesity rates.
Results and Spatial Mapping
By applying this model to 40 US states, the "digital estimation" mirrored the official 2013 CDC data with remarkable accuracy.
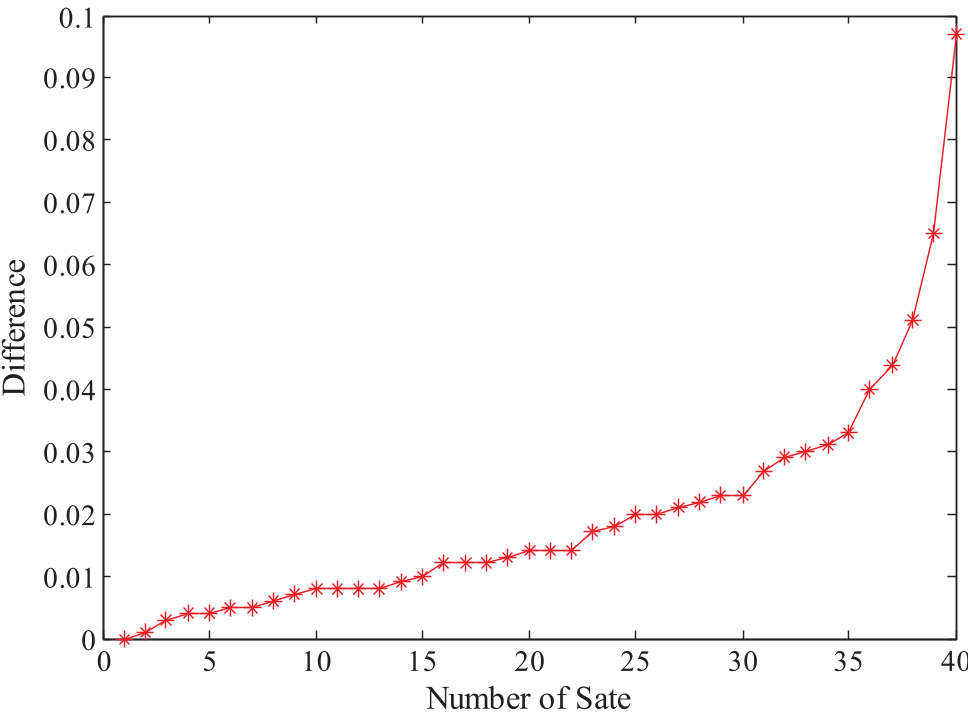 Figure 3: Heatmap error analysis showing that most states fall within a < 0.02 deviation from official statistics.
Critical Analysis & Conclusion
This paper proves that the "Social IoT" is a viable alternative to hardware-heavy surveillance. However, it faces a Geographic Bias: only a fraction of users enable geotagging, potentially skewing data toward more tech-savvy or urban demographics.
Takeaway: Future public health platforms should integrate OSN mining as a "first-response" layer to identify burgeoning health crises before they show up in clinical records. The next step? Applying this to multi-modal data (images of food) and more complex non-linear models like LSTMs to capture the long-term temporal shifts of chronic disease.