
Localizing and Quantifying Damage: Turning Social Media into a Low-Cost Disaster Sensor
Localizing and Quantifying Damage in Social Media Images
This paper introduces a novel framework for disaster assessment using social media images by combining VGG19-based classification with Gradient-weighted Class Activation Mapping (Grad-CAM). The core method generates "Damage Detection Maps" (DDM) to localize destruction and a "Damage Assessment Value" (DAV) to quantify severity on a continuous scale, achieving up to 95.5% classification accuracy on curated datasets.
TL;DR
In the wake of natural disasters, social media becomes a firehose of raw, on-the-ground visual data. This paper presents a framework that uses Fine-tuned VGG19 and Grad-CAM to automatically locate damage within these images and assign a continuous Damage Assessment Value (DAV). Unlike traditional methods that require expensive satellite data, this approach leverages human-centric perspectives to provide high-resolution, real-time insights for emergency responders.
Background: Beyond the Satellite View
While remote sensing (GIS) offers a macro-level view of disasters, it is plagued by high costs, complex processing, and vulnerability to cloud cover. Social media images, posted by eyewitnesses, provide a "higher resolution" of human impact but are notoriously noisy. Previous attempts at localization treated damage like objects (e.g., a "car" or "house"), but damage is a concept with fuzzy boundaries. This paper argues that we don't need bounding boxes; we need heatmaps.
Methodology: From Classification to Localization
The authors propose a multi-stage pipeline that transitions from simple "Damage vs. No Damage" classification to sophisticated spatial analysis.
1. Feature Extraction and Classification
The architecture utilizes a VGG19 backbone, pre-trained on ImageNet and fine-tuned on disaster-specific datasets (Nepal, Ecuador, etc.). By replacing the final 1000-class layer with a binary softmax layer, the model learns the visual vocabulary of destruction—cracks, rubble, and structural failure.
2. The Damage Detection Map (DDM)
Using Grad-CAM, the model calculates the gradients of the "Damage" class score with respect to the feature maps of the final convolutional layer. This "weakly supervised" approach is brilliant because it tells us why the model thinks an image shows damage without ever being shown a manual box around the rubble.
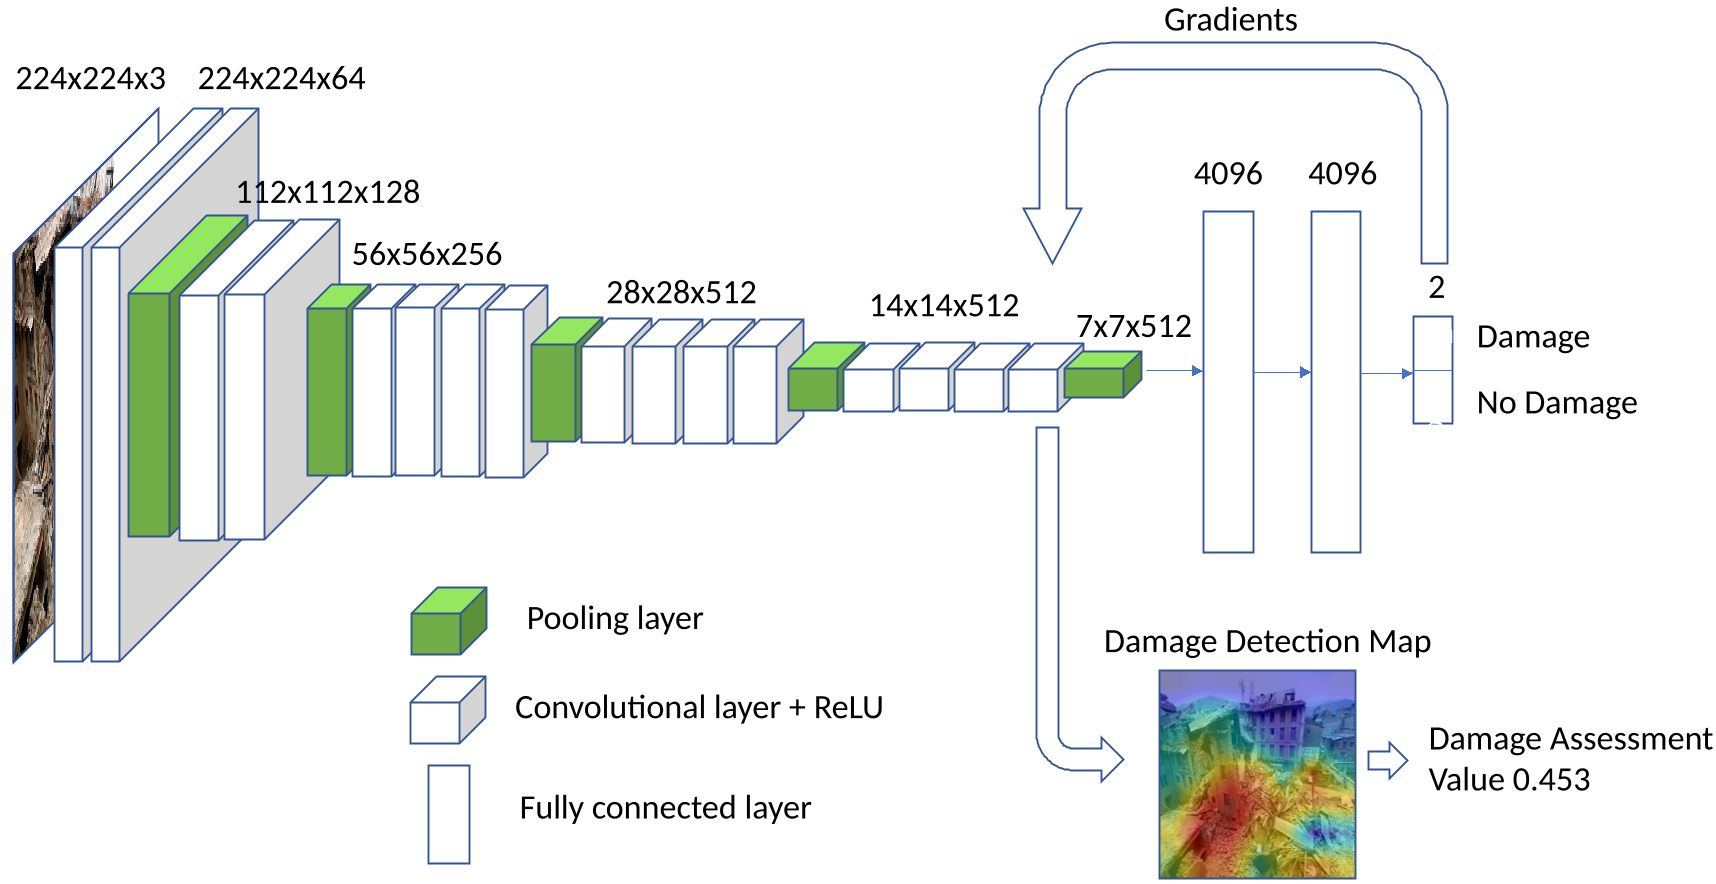 Figure 1: The framework pipeline from raw image to Damage Detection Map (DDM) and Damage Assessment Value (DAV).
3. Quantifying Severity (DAV)
The Damage Assessment Value (DAV) is the global average of the heatmap intensity. This transforms a qualitative visual explanation into a quantitative metric, allowing responders to rank images by the intensity of destruction.
Experimental Insights
The model was validated on diverse datasets, including the Nepal and Ecuador earthquakes.
- Localization Precision: The DDM achieved an average IOU (Intersection over Union) of ~0.517 compared to human annotators. Given that human-to-human agreement was only 0.610 (highlighting the subjectivity of "damage"), the model performs remarkably close to human intuition.
- Continuous vs. Discrete: While a standard CNN classifies images into "Severe" or "Mild," the DAV score provides a continuous spectrum. This is crucial for prioritizing aid when resources are limited.
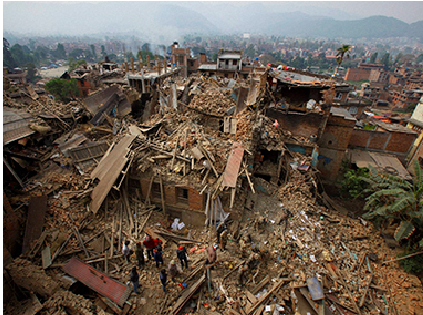 Figure 2: Qualitative results showing original images (top) and their corresponding DDM heatmaps (bottom). Note how high-intensity areas correlate with structural debris.
Critical Analysis & Takeaways
The strength of this work lies in its interpretability. For disaster response teams, a "black box" prediction is dangerous. By providing a heatmap, the model offers a "visual proof" that it is looking at the collapsed roof rather than just a cloudy sky.
Limitations:
- Dataset Noise: The paper acknowledges that some ground-truth labels in social media datasets are incorrect (e.g., images of people classified as "damage").
- Architecture: While VGG19 is robust, modern Vision Transformers (ViTs) might capture more global context which could refine localization.
Future Outlook: The integration of Geo-tagging with DAV scores could allow for the creation of real-time "Damage Maps" of entire cities, generated entirely from public tweets and Instagram posts. This work paves the way for a more democratic and rapid form of humanitarian aid.
Conclusion
This paper successfully bridges the gap between deep learning interpretability and practical humanitarian needs. By turning "visual explanations" into "damage quantifiers," the authors provide a scalable, low-cost tool that could save lives by getting the right information to the right people faster than ever before.