
Decoding the Physical Social Graph: A Deep Dive into Early LSN Behaviors
Analysis of a Location-Based Social Network
This paper presents the first large-scale quantitative analysis of Brightkite, a commercial Location-based Social Network (LSN). It investigates user demographics, mobility patterns, social graph topologies, and trait correlations using a two-month dataset of over 300,000 activity updates.
TL;DR
This study provides the first comprehensive look into how people actually use Location-based Social Networks (LSNs). By analyzing Brightkite—a pioneer in "check-in" culture—the researchers uncovered that our digital social status is inextricably linked to our physical movement: popular users move more, travel further, and post more frequently.
Context: When Social Met Spatial
In 2008, as smartphones began their global ascent, a new breed of social network emerged. Unlike Facebook, which focused on who you were, and Twitter, which focused on what you were thinking, Brightkite focused on where you were. This paper fills a critical gap in academic literature by transitioning from theoretical mobility models to real-world application data where location sharing is a voluntary, social act.
Problem & Motivation
Most previous mobility research relied on passive data—WiFi logs or cell tower handovers—which often lacked the "Human-in-the-loop" aspect. We knew where devices went, but we didn't know why or who the person behind the device was. Brightkite provided a unique laboratory to test a key hypothesis: Does your social circle influence your physical mobility?
Methodology: The Core
The authors didn't just look at dots on a map. They combined three distinct data layers:
- User Profiles: Age, gender, and interests (tags).
- Social Graph: Friendship links between 13,000+ active users.
- Activity Traces: 300,000+ check-ins, photos, and notes.
Using the X-Means clustering algorithm, they successfully categorized user mobility into four intuitive groups: Home users (static), Home-Vacation (periodic trips), Home-Work (commuters), and "Other" (highly unpredictable nomads).
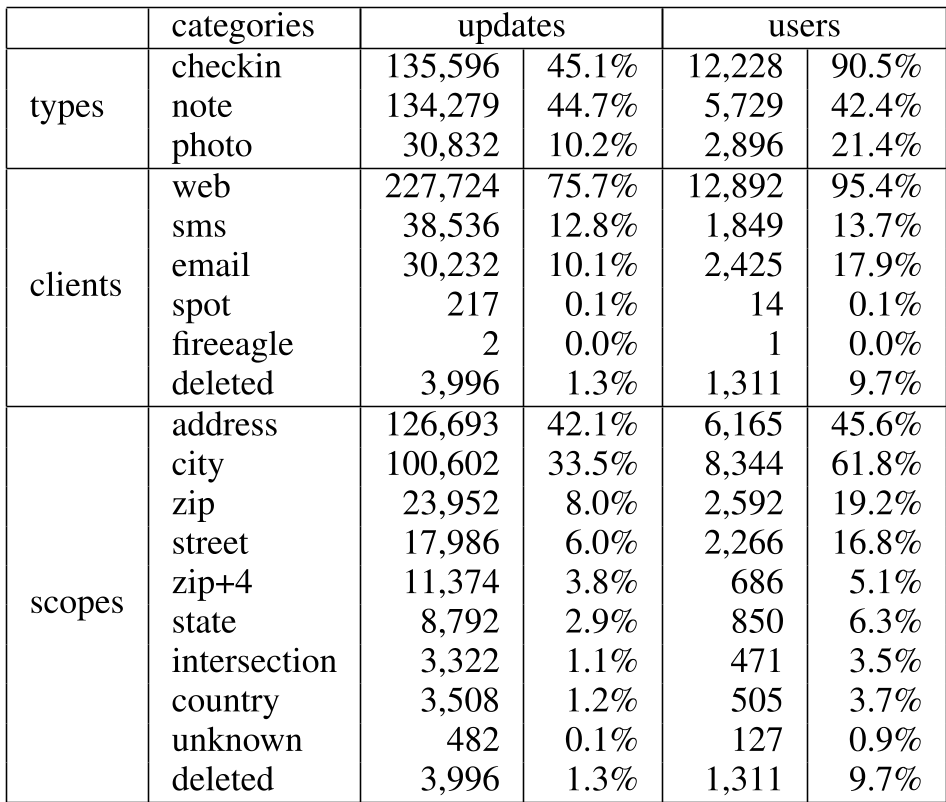 Table 1: Distribution of activity updates across types, clients, and spatial scopes.
Key Insights: Social Popularity = Physical Mobility
One of the most striking findings is the correlation between social degree (number of friends) and mobility metrics.
- The Popularity-Path Link: Users with more than 10 friends have an average update count of 53.07, compared to the overall average of 22.25.
- The Predictability Paradox: While we might think more data makes a user easier to predict, the high mobility of socially active users actually makes their next location harder to guess (negative correlation with prediction accuracy).
- Client Influence: Users who use SMS/Email to check in (likely on the move) are significantly more mobile than those using the Web interface.
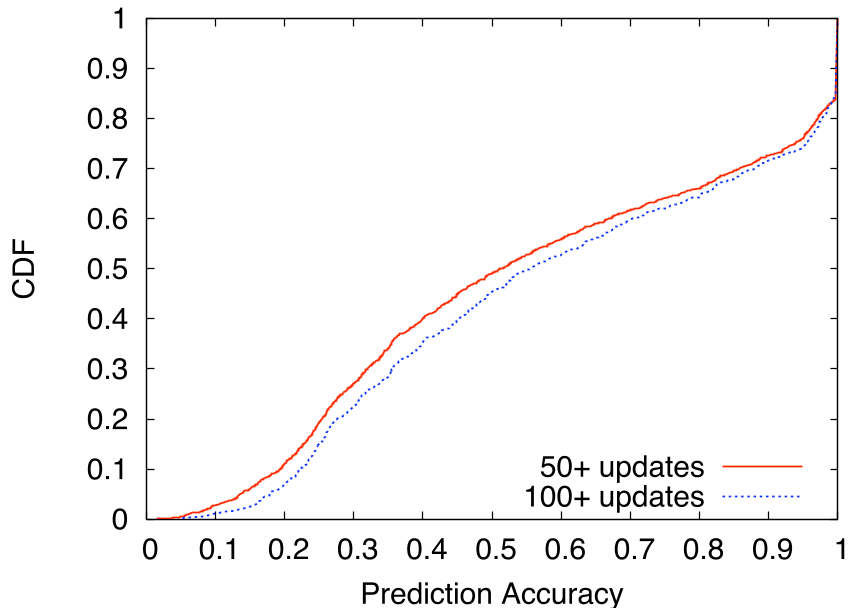 Figure 3: The degree distribution follows a power law, typical of organic social networks, but with a sparser structure (slope -1.9) compared to Twitter.
Detailed Results & User Taxonomy
By applying EM (Expectation-Maximization) clustering across eight different attributes, the study defines five archetypes of LSN users:
- Trial Users (41%): The largest group; they check in once or twice and never return.
- Inactive (30%): Occasional users with minimal social links.
- Normal (16%): The "loyal" base who check in every other day.
- Mobile (8%): The travelers with huge movement diameters.
- Active (6%): The "Social Butterflies" who dominate the updates.
 Table 5: User classification based on multiple behavioral attributes.
Critical Analysis & Conclusion
The Takeaway
For product designers and researchers, this paper proves that LSNs are not just "digital maps" but extensions of professional and social networking. The link between high social degree and high mobility suggests that social signals are leading indicators of spatial behavior.
Limitations & Future Work
The authors candidly admit to the "Honesty Gap"—since Brightkite doesn't verify location, a user could theoretically forge a check-in. Furthermore, the dataset only captured public updates, potentially missing the behavior profiles of more privacy-conscious users.
The legacy of this work lies in its early recognition that our "social" and "spatial" selves are one and the same—a foundation upon which modern services like Uber, Yelp, and Instagram were built.