
Decoding the Pulse of the City: Urban Activity Clustering via Social Media Footprints
Using Data from Location Based Social Networks for Urban Activity Clustering
This paper introduces a novel urban computing framework that clusters city regions based on temporal activity profiles derived from Location-Based Social Network (LBSN) check-ins. By applying spectral clustering and Evidence Accumulation Clustering (EAC) to Foursquare data, the authors segment cities into functional areas like nightlife zones or business districts.
Executive Summary
TL;DR: This research leverages Foursquare check-in data to "fingerprint" urban districts. By treating the temporal distribution of human check-ins as an activity profile, the authors use advanced spectral clustering to segment a city into functional zones—such as nightlife hubs, residential areas, and industrial clusters—without needing invasive data like cell phone records or manual surveys.
Positioning: This work sits at the intersection of Urban Computing and Spatio-Temporal Data Mining. It transitions from simply mapping where people are to understanding what they are doing, effectively bridging the gap between raw coordinates and semantic urban functionality.
Problem & Motivation: The Static City vs. The Living Network
Urban planners have traditionally relied on static zoning maps. However, a "Business District" on paper might function as a "Nightlife Hub" after 8 PM.
- The Data Gap: Official municipal data is often low-resolution and fails to capture "socio-dynamics"—the actual behavior of residents.
- The Privacy Barrier: While cell phone data offers high coverage, it is locked behind legal paywalls and raises significant privacy concerns.
- The Solution: Location-Based Social Networks (LBSNs) like Foursquare provide public, fine-grained, and semantically rich data (e.g., "This coordinate is a Bar"). The challenge lies in the sparsity of this data, especially outside major US hubs.
Methodology: From Time-Series to Urban Segments
The authors propose a multi-stage pipeline to transform noisy check-ins into stable urban clusters.
1. The Activity Profile
Each venue is characterized by a 24-integer vector representing check-in counts per hour. Instead of simple Euclidean distance, the authors use a Qualitative Shape Comparison. If Venue A and Venue B both see a "relative increase" in activity between 10 PM and 11 PM, they are considered similar, regardless of absolute check-in volume.
2. Spectral Clustering & EAC
To find clusters of arbitrary shapes (unlike K-Means which assumes circular blobs), the authors use Spectral Clustering. To solve the "K-problem" (not knowing how many districts a city has), they employ Evidence Accumulation Clustering (EAC).
- They run the clustering 2,000 times with random values for .
- An association matrix is built to count how often two venues end up in the same cluster.
- The final result is derived from this "consensus," making the model robust to outliers.
 Note: The formula above represents the Affinity Measure used to calculate the similarity () between two venue profiles.
Experiments & Results: Mapping Cologne
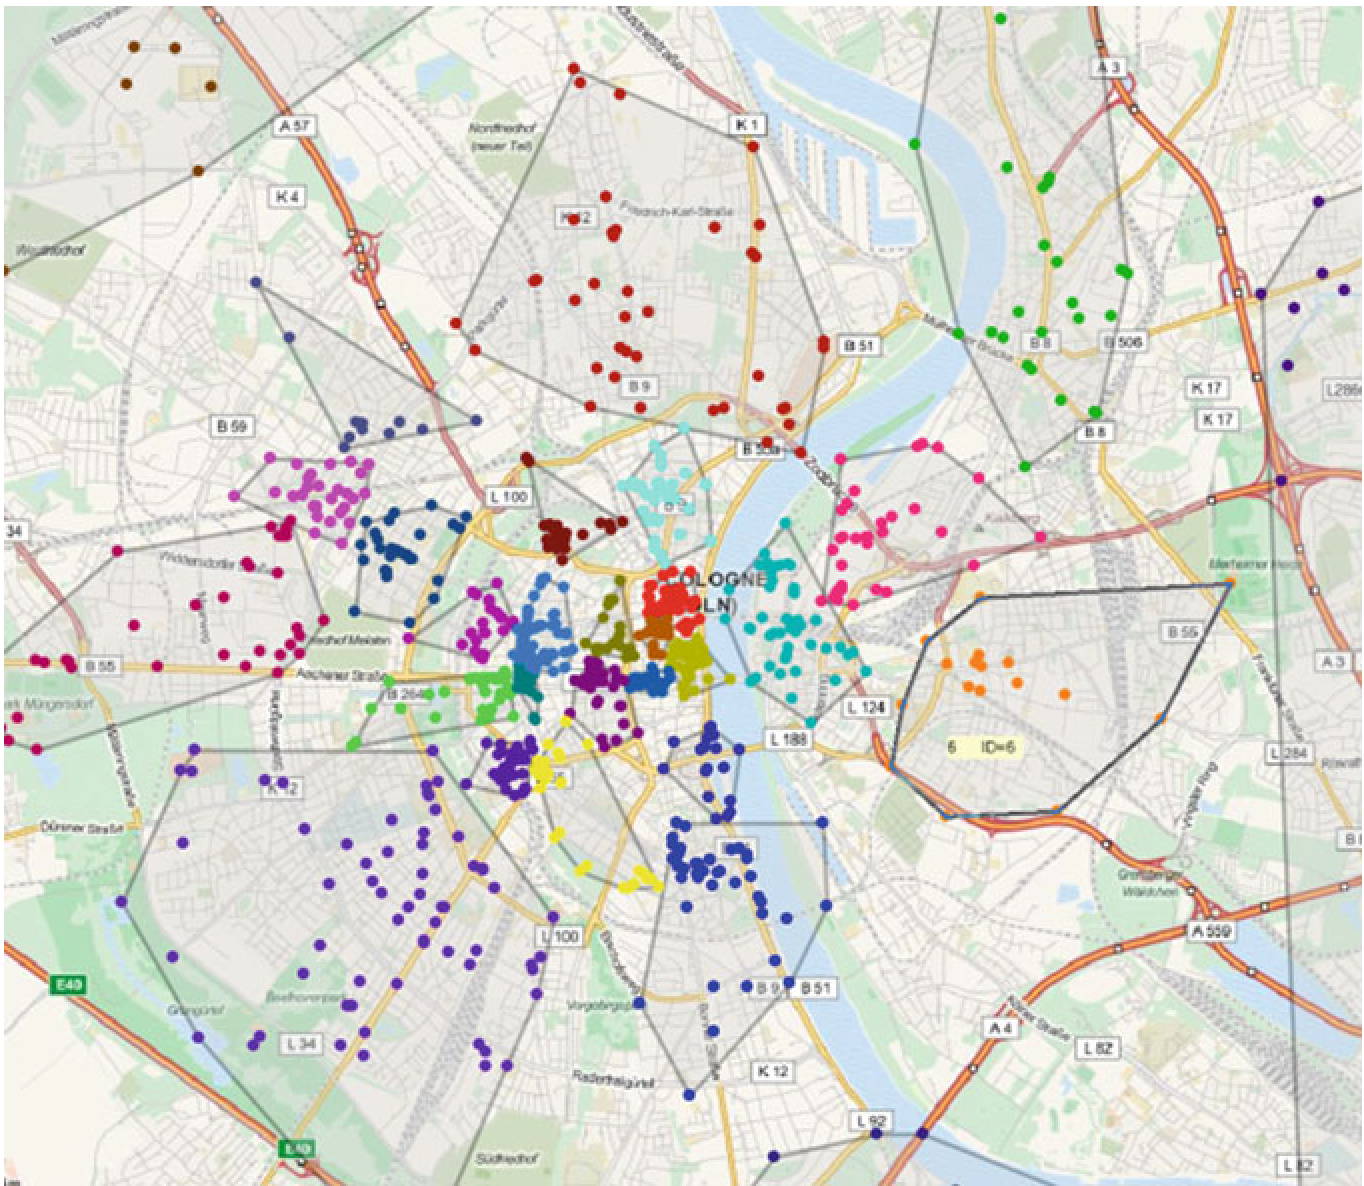
The authors applied this to Cologne, Germany (a dataset of ~11,890 check-ins).
Functional Discovery
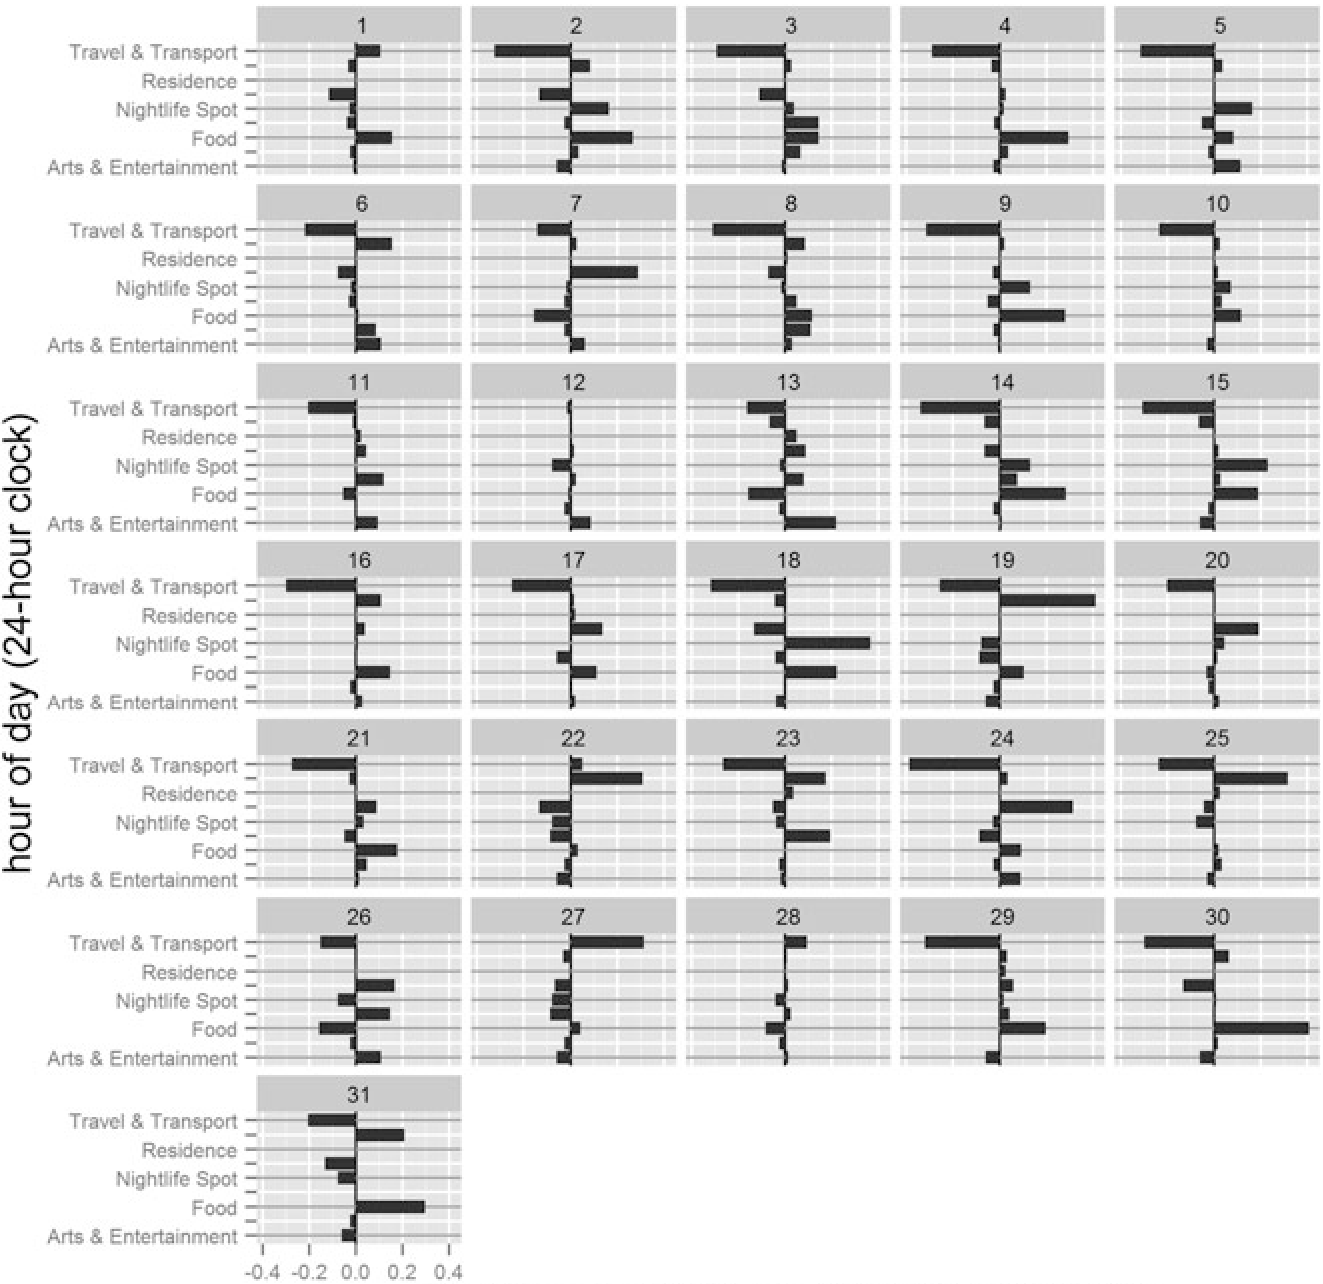
The algorithm identified 31 regions. The profiles revealed distinct "City Topics":
- Nightlife Hubs (Clusters 5, 15, 18): Showed massive activity spikes between 8 PM and 3 AM.
- Work Zones (Clusters 19, 23, 24): Activity peaked strictly between 10 AM and 3 PM.
- Transport Hubs (Cluster 1): Mirrored the city's average profile perfectly, reflecting the morning and evening rush hours.
 The figure highlights how different clusters deviate from the city's average check-in behavior.
Sammon’s Projection: The Color of Activity
To make these 24-dimensional profiles understandable, they used Sammon’s Mapping. This converts the activity vector into a color.
- Green: High Nightlife.
- Blue: Daytime/Work.
- Red: Average/General.
 Spatial distribution of clusters in Cologne, where color represents functional similarity.
Critical Analysis & Conclusion
Takeaway
This work demonstrates that LBSN data is a viable, high-resolution alternative for urban analysis even in regions where data is relatively sparse. It provides a blueprint for "Dynamic Zoning"—understanding how the city's function shifts by the hour.
Limitations
- Demographic Bias: The users of Foursquare (likely younger, tech-savvy individuals) do not represent the entire population. The "activity profile" of a city through Foursquare is skewed toward entertainment and travel.
- Scalability: Spectral clustering is computationally expensive (). For "Big Data" applications across an entire country, more efficient approximations will be required.
Future Outlook
The next frontier is Cross-Platform Fusion. By combining LBSN data with Twitter (sentiment analysis) and OpenStreetMap (geometric features), we can build "Digital Twins" of cities that react to events, disasters, and social shifts in real-time.