
Algorithm Selection for Financial EWS: Predicting the Flight of Global Capital
Machine Learning Algorithm Selection for Forecasting Behavior of Global Institutional Investors
This paper establishes an Early Warning System (EWS) to forecast the potential massive pullout of Global Institutional Investors (GII) from emerging markets, specifically Korea. The study compares four machine learning paradigms—Multivariate Logistic Regression (MLR), Decision Trees (DT), Artificial Neural Networks (ANN), and Case-Based Reasoning (CBR)—to determine the optimal algorithm for short-term and long-term financial behavioral forecasting.
In the hyper-connected world of global finance, emerging markets like South Korea exist in a state of perpetual "calculated risk." Global Institutional Investors (GII) hold significant market capitalization, but their tendency for herding behavior and positive feedback trading means they can exit a market en masse at the first sign of trouble. This paper investigates how to build a robust Early Warning System (EWS) specifically designed to forecast these pullouts using a comparative machine learning approach.
TL;DR
The study evaluates MLR, Decision Trees, ANN, and CBR for forecasting GII behavior. The core finding is a trade-off in "Inductive Bias": Decision Trees dominate short-term (daily) forecasts, whereas nonparametric models like Case-Based Reasoning (CBR) are far more effective for long-term (monthly) strategic warnings.
The "Gray Zone" and the Oracle: A Two-Phase Methodology
Traditional financial EWS often look at macroeconomic fundamentals (GDP, unemployment). However, institutional pullouts are often triggered by short-term sentiment shifts. To capture this, the authors adopt a two-phase training architecture:
- Phase I: The Oracle Classifier: This defines the "Ground Truth." By looking at historical net sales of GII across quarterly, monthly, and daily windows, it labels periods as Stable (SP), Transition (TP), or Crisis (CP). The "Transition Period" (or Gray Zone) is critical—it is the window where GII switch from a net long to a net short position.
- Phase II: The Lag Classifier: This is the actual predictive model. It uses variables like the KOSPI index, exchange rates, and index futures to predict the future oracle label with a lag of days (where is 1, 5, or 20).
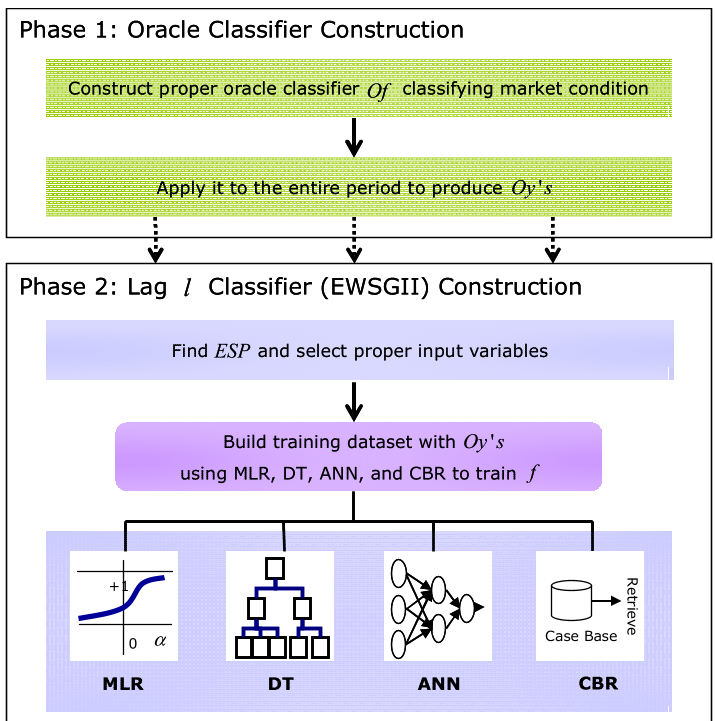
Machine Learning Candidates: Parametric vs. Nonparametric
The paper puts four distinct "logic styles" to the test:
- Multivariate Logistic Regression (MLR): A classic parametric approach. It struggles here because financial data rarely follows a clean logistic curve.
- Decision Trees (DT - CART): Excellent for interpretable, hierarchical rules. It proves highly effective for short-term signals where specific threshold triggers are dominant.
- Artificial Neural Networks (ANN): Known as universal function approximators. Their "overfitting" tendency is actually a feature here, allowing them to capture the high-volatility "Gray Zones" that linear models miss.
- Case-Based Reasoning (CBR): A "lazy learning" approach that looks at the most similar historical instances (Nearest Neighbors) to predict the future.
Experimental Results: Why Time Horizon Matters
The authors tested these algorithms on Korean Stock Market data from 1999 to 2004, covering the recovery from the 1997 Asian crisis and the 9/11 shocks.
Key Performance Patterns:
- Short Term (): Decision Trees performed best. Short-term movements are often reactive and follow simpler, rule-based triggers that DTs capture efficiently.
- Long Term (): CBR and ANN showed superior performance. For month-long horizons, the system needs to identify a "stationary relation" between current volatility and future crisis states—something these nonparametric models do by relaxing assumptions about data distribution.
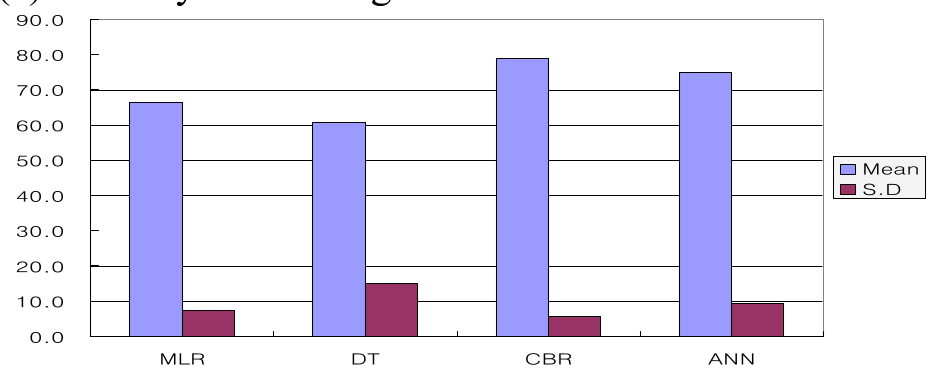
(The graph above illustrates that as the forecasting horizon increases, nonparametric models maintain more stable hit rates compared to the sharp decline in parametric efficiency.)
Critical Analysis & Conclusion
The paper's most significant contribution is the empirical proof that there is no "one-size-fits-all" algorithm for financial EWS.
Insights:
- The Overfitting Paradox: While ML theory often warns against overfitting, in the context of financial "Gray Zones"—which are by definition abnormal and short-lived—the ability of ANNs and CBR to "memorize" and recognize these rare patterns is a defensive advantage.
- Stationarity: For a forecast to work, there must be a time-invariant relationship between the features () and the label (). The authors found that data normalization and focusing on "Enormous Selling Periods" (ESP) were required to keep the model "stationary."
Limitations & Future Work:
While the model captures GII behavior, it does not yet integrate macro-level "stamina" indicators like Foreign Direct Investment (FDI) or national reserves. Future iterations of EWSGII would benefit from a Hybrid Multi-Scale architecture, using DTs for daily monitoring and CBR/Long Short-Term Memory (LSTM) networks for strategic monthly outlooks.
Takeaway: If you are building a system to predict long-term financial shifts, stop looking for a formula (parametric) and start looking for a pattern (nonparametric).