
Beyond the Markov Chain: How Machine Learning Redefines Recession Detection
Machine Learning for Classification of Economic Recessions
This paper evaluates Machine Learning (ML) techniques, specifically K-Nearest Neighbor (KNN) and Neural Networks (NN), for the classification of economic recession periods. The authors compare these models against the established Dynamic Factor Markov Switching (DFMS) model, achieving a State-Of-The-Art (SOTA) AUC score of 0.97 with the Neural Network approach.
TL;DR
Economists have long relied on the Dynamic Factor Markov Switching (DFMS) model to identify recessions, but these models often struggle with the complexity and lag of real-time data. This study demonstrates that Neural Networks (NN) and K-Nearest Neighbor (KNN) models significantly outperform traditional econometric methods, achieving an AUC of 0.97 compared to the 0.82 of DFMS. By treating recession detection as a non-linear binary classification problem, these ML models provide faster and more accurate insights into economic turning points.
The "Lagger" Problem in Macroeconomics
The National Bureau of Economic Research (NBER) is the "gold standard" for dating recessions, but they prioritize accuracy over speed. Consequently, their announcements can lag behind reality by nearly two years. For policymakers, this is too slow.
The technical challenge lies in three areas:
- Asymmetry: Expansions and contractions behave differently; they aren't mirror images.
- Comovement: Multiple indicators (employment, production, income) move together, requiring multivariate analysis.
- Ragged Edges: Real-time economic data is messy. Different indicators are reported at different times, leaving "holes" at the end of a dataset.
Methodology: Bridging Econometrics and AI
The authors utilized the four core Coincident Economic Indicators (CEI)—Nonfarm payrolls, industrial production, real income, and manufacturing sales—to train their models.
1. Neural Network Architecture
The NN model uses a multi-layer perceptron (MLP) design. It addresses the time-series nature of the data by including lagged variables (Time and ), effectively doubling the input feature space to eight dimensions.
- Activation: Sigmoid (ideal for binary classification).
- Optimizer: RMSProp (handles sparse data efficiently).
- Regularization: Dropout layers to prevent the model from "memorizing" specific historical cycles (overfitting).

2. KNN with Bagging
Classic KNN identifies the state of the economy by looking at the "distance" to previous historical periods in the feature space. To solve the instability of KNN in noisy markets, the authors used Bootstrap Aggregation (Bagging), averaging 100 iterations of the algorithm to generate a stable recession probability.
Experimental Results: A Clear Winner
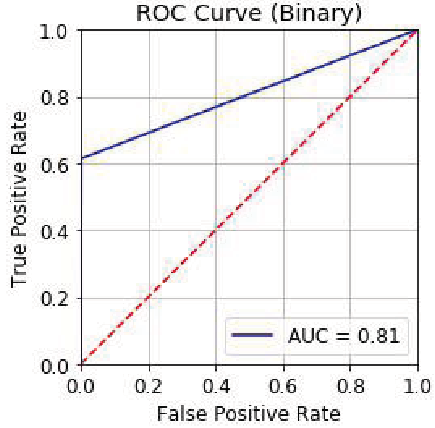
The models were evaluated using Receiver Operator Characteristic (ROC) analysis. The Area Under the Curve (AUC) measures a classifier's ability to distinguish between expansion and recession.
- DFMS (Baseline): AUC 0.82
- KNN: AUC 0.94
- Neural Network: AUC 0.97
The results (visualized below) show that the Neural Network's curve hugs the top-left corner far more tightly than the traditional DFMS, indicating a near-perfect ability to identify a recession without excessive false alarms.
Deep Insights: Why Does AI Outperform?
The primary reason for the success of the NN is its Inductive Bias. Traditional DFMS models assume a specific probabilistic structure (Markov chains). If the economy's transition doesn't perfectly follow that mathematical "script," the model fails.
In contrast, the Neural Network is a Universal Function Approximator. It doesn't care about the underlying "rules" of the transition; it learns the high-dimensional boundary that separates prosperity from crisis directly from the data. Furthermore, by using an autoregressive approach (feeding values), the NN captures the momentum of the economy, which is vital for detecting sudden turning points.
Conclusion & Future Outlook
This research marks a significant push for Machine Learning in a field traditionally dominated by linear time-series analysis.
Key Takeaways:
- Non-linearity is Essential: Economic regimes are too complex for simple linear filters.
- ML is Production-Ready: With an AUC of 0.97, Neural Networks can be reliably used for real-time monitoring.
Limitations: The model is a "black box" compared to DFMS, which provides clear transition probabilities. Future research should look into Explainable AI (XAI) to help economists understand why the network is flagging a recession—whether it's driven by a collapse in industrial production or a sudden drop in real income.