
From Data to Dirt: Advanced Machine Learning for 3D Soil Stratification
Machine learning method for CPTu based 3D stratification of New Zealand geotechnical database sites
This paper introduces a comprehensive machine learning framework for three-dimensional (3D) geotechnical site stratification using Piezocone Penetration Test (CPTu) data. The system combines a Random Forest classification model, a modified Wavelet Transform Modulus Maxima (WTMM) boundary detection method, and Generalized Regression Neural Network (GRNN) interpolation to achieve high-accuracy soil profiling, validated on the New Zealand Geotechnical Database (NZGD).
TL;DR
Geotechnical engineers traditionally rely on manual interpretation of Piezocone Penetration Tests (CPTu). This paper presents a fully automated 3D stratification workflow that leverages Random Forest for soil classification, a modified Wavelet Transform for boundary detection, and GRNN for spatial interpolation. The result is a 93% accuracy rate in 1D profiling and a robust method for building 3D soil models directly compatible with BIM and numerical analysis.
The Problem: The Gap Between "Behavior" and "Physics"
For decades, the standard for CPTu interpretation has been the SBTn (Soil Behavior Type) chart. While useful, it identifies how soil behaves rather than what it is. In civil engineering design, we need classifications based on physical characteristics (like the Unified Soil Classification System - USCS).
The technical hurdles are three-fold:
- Feature Extraction: Standard models only use mean values of cone resistance (), missing the "noise" or variation that actually signals soil texture.
- Boundary Blur: Transition zones between hard and soft layers confuse current algorithms, leading to boundary errors exceeding 0.5 meters.
- Spatial Sparsity: Boreholes and CPTu points are expensive and sparse, making 3D interpolation mathematically "undetermined."
Methodology: Capturing the "Texture" of the Earth
1. Feature Engineering with Local Deviation
The authors' core insight is that variability is information. Gravel layers produce more erratic CPTu signals than silts. By introducing a "local deviation" parameter (), calculated as the root-mean-square of differences between adjacent sampling points, the Random Forest model can distinguish Gravel with 93.8% accuracy—nearly double the performance of traditional charts.
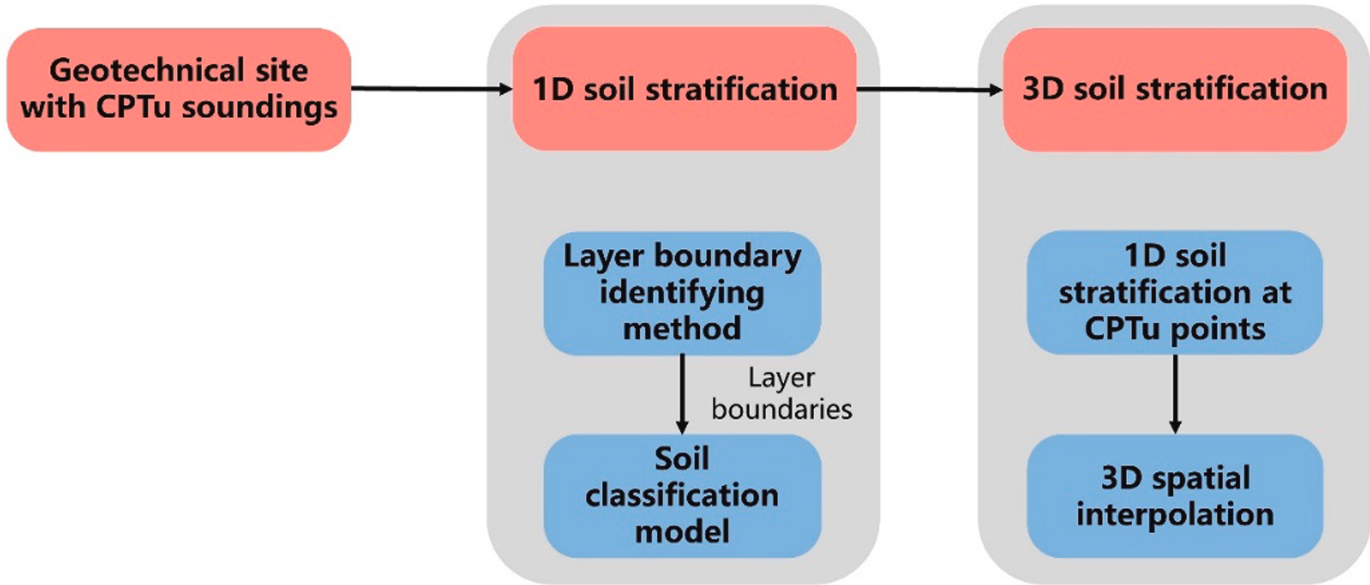 Figure 1: The proposed workflow from 1D CPTu measurements to 3D site models.
2. Fixing the Boundary Problem
The Wavelet Transform Modulus Maxima (WTMM) is great at finding changes in signals but fails in long transition zones. The authors modified this by scanning downward from the initial WTMM boundary using a moving window. If continues to rise, the boundary is shifted to the "true" contact point, reducing location errors to less than 0.25 meters.
3. GRNN: Local Mapping for 3D Interpolation
To move from points to a 3D volume, the study uses a Generalized Regression Neural Network (GRNN). Unlike Kriging, which requires complex variogram estimation, the GRNN uses a Gaussian transfer function to weight the influence of known CPTu points based on their distance. This provides a "smooth" yet locally accurate transition between different soil volumes.
Experimental Results & Validation
The system was tested against the New Zealand Geotechnical Database (NZGD), specifically sites in Christchurch and the North Island.
- 1D Success: The model correctly identified 72.02m out of 77.58m of total soil profile length.
- Classification Superiority: Compared to the industry-standard SBTn chart, the proposed model significantly reduced scatter and misclassification of Gravel and Silt.
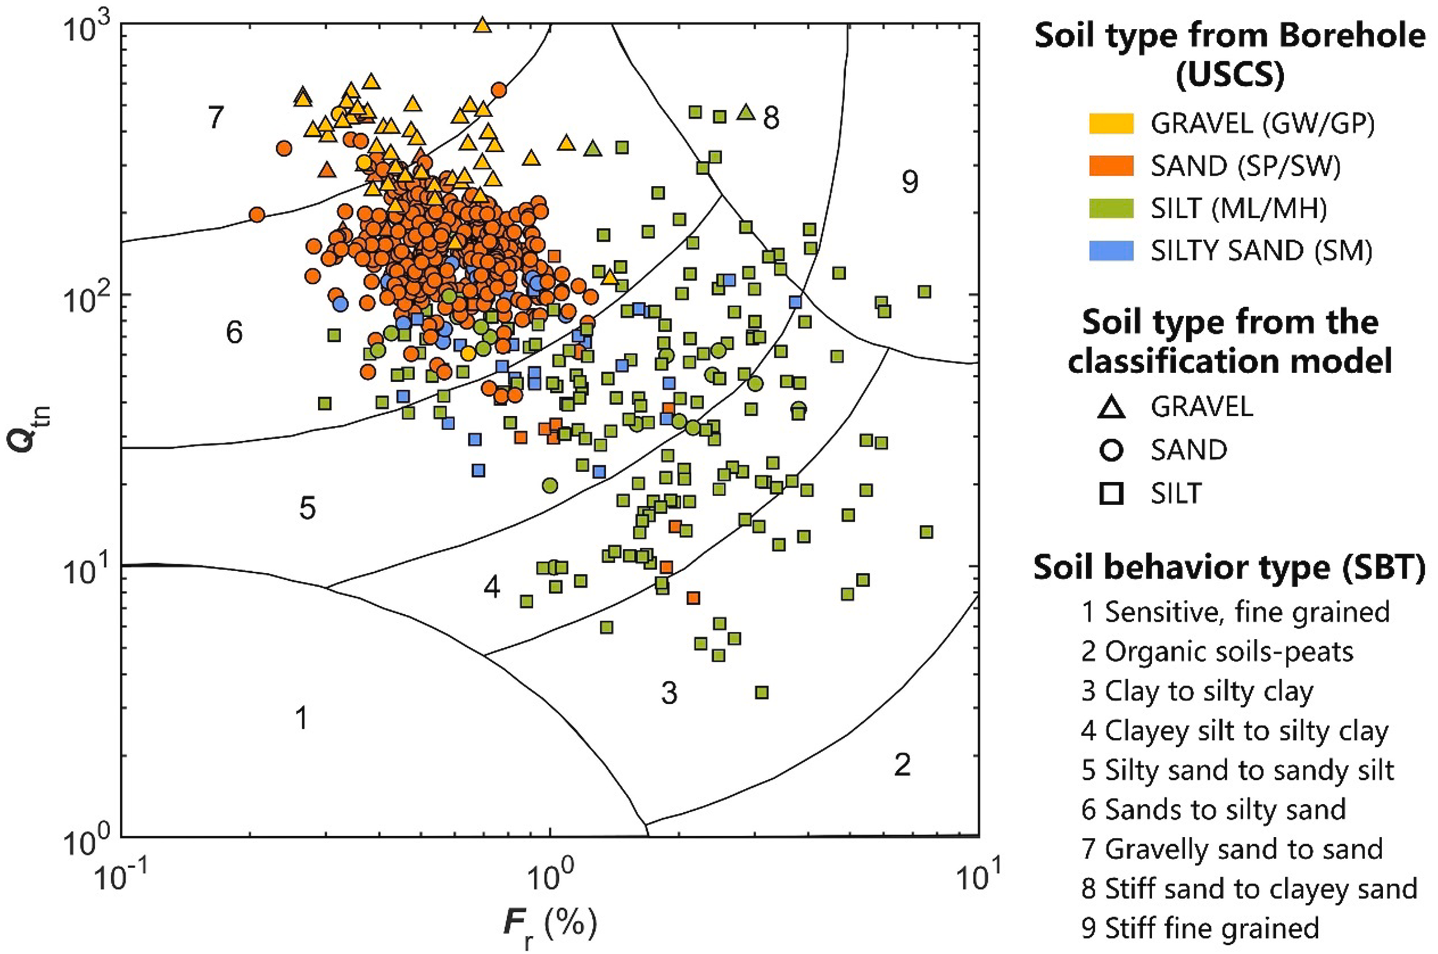 Figure 2: Performance comparison—the proposed ML model (right) vs. the traditional SBTn chart (left) showing much tighter clustering with physical reality.
3D Site Reconstruction
At "Site 1" (a area), the GRNN interpolation achieved a 94.83% accuracy in predicting soil types at unsampled validation locations. The resulting 3D models clearly visualize silt lenticles trapped within sand layers, vital information for assessing bearing capacity or liquefaction risk.
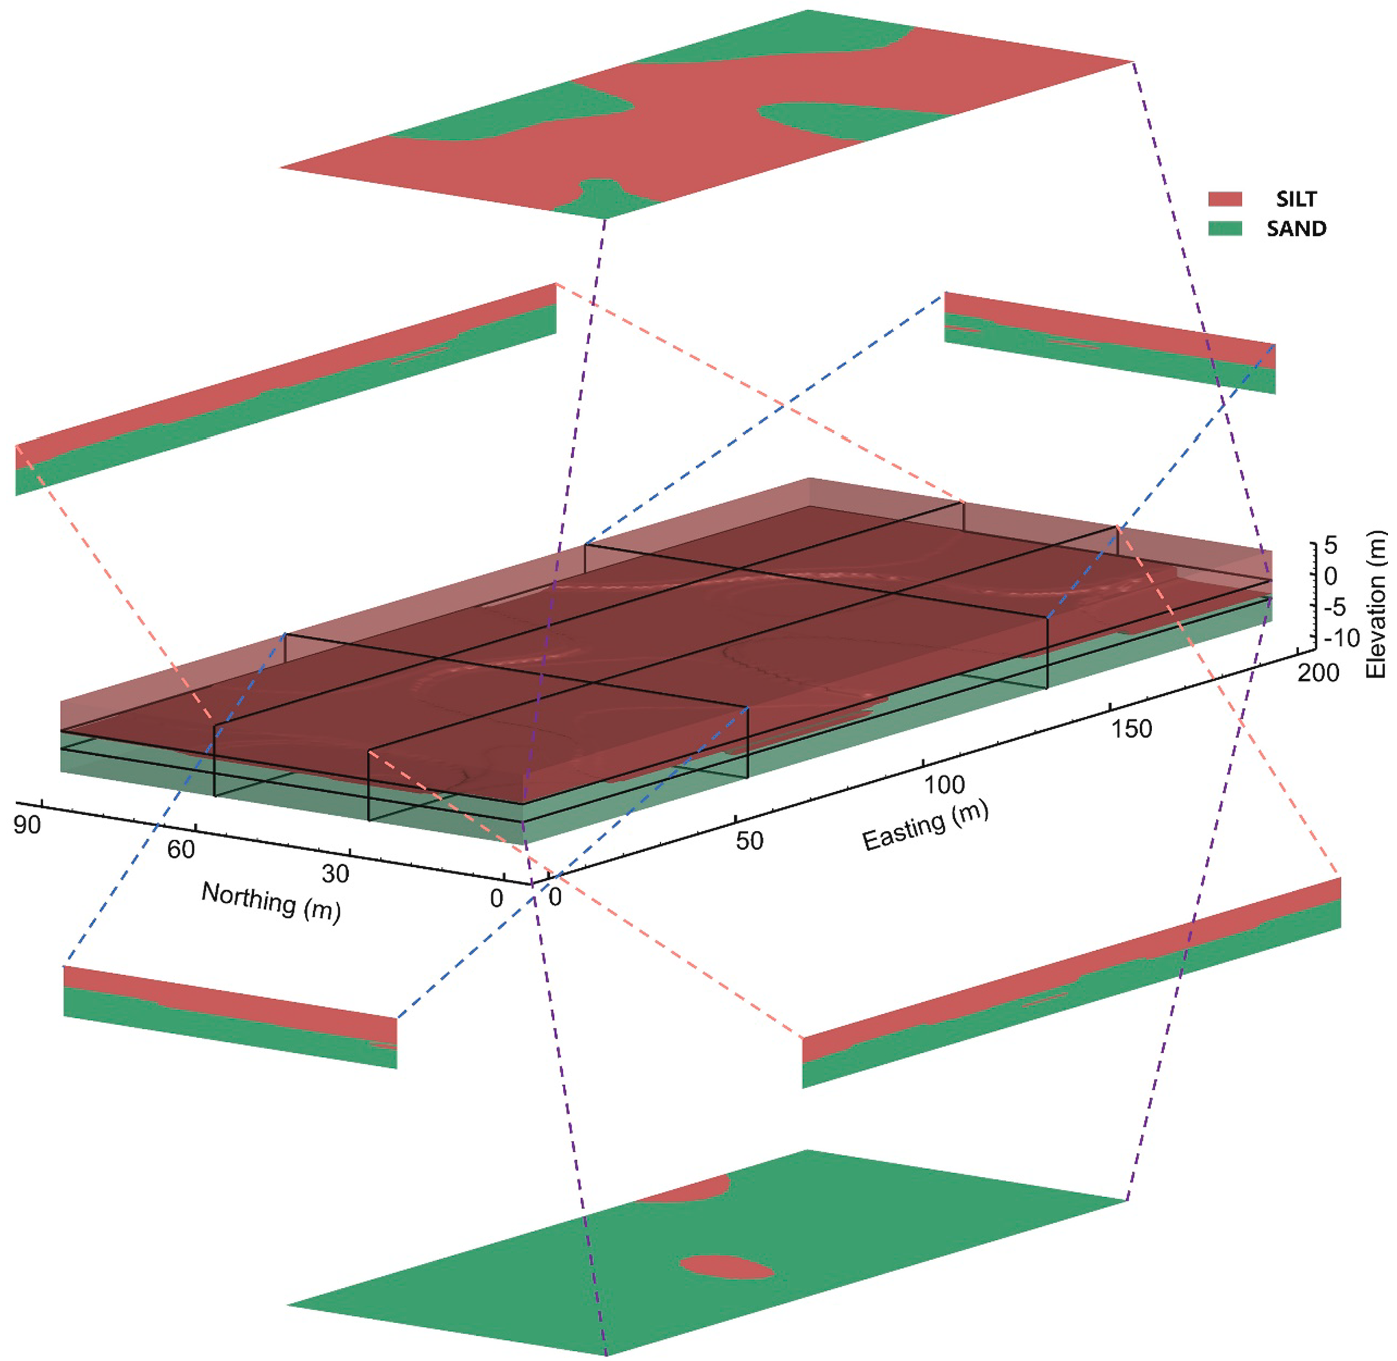 Figure 3: A fully reconstructed 3D geotechnical model for Engineering Site 1.
Critical Insight & Conclusion
The true value of this paper lies in its Inductive Bias. By recognizing that geotechnical data is inherently spatial and that signal "noise" contains structural information, the authors moved machine learning in geotechnics from simple curve-fitting to physics-aware classification.
Limitations: The model is currently optimized for Gravel, Sand, and Silt. Future work is required to adapt this to "special" soils, such as the volcanic pumice found in specific regions of New Zealand, which may have different signal characteristics.
For civil engineers, this represents a major step toward "Digital Twin" geotechnical sites, where CPTu data can be instantly transformed into 3D numerical models for seismic and foundation analysis.