
Estimating Wealth from Space: A Geospatial ML Approach to Thailand’s Median Income
A machine learning approach to estimate median income levels of sub-districts in Thailand using satellite and geospatial data
This paper presents a machine learning approach to estimate sub-district median income levels in Thailand by integrating VIIRS nighttime light (NTL) radiance with geospatial features. Utilizing a Gradient Boosting Classifier, the study categorizes 6,839 sub-districts into three income tiers, achieving a high SOTA-level F1 score of 0.82.
TL;DR
In developing nations, high-resolution economic data is often a luxury. This paper introduces a robust machine learning framework that uses satellite nighttime lights and geospatial proximity to estimate median income levels for 6,839 sub-districts in Thailand. By moving beyond traditional surveys, the authors achieved an F1 score of 0.82, proving that "where you are" and "how much light you emit" are powerful proxies for "how much you earn."
The Data Dearth in Socioeconomics
Policy planners in developing countries face a "data black hole." Traditional census methods are updated once every few years and cost millions. Without granular data, it is nearly impossible to tell if a poverty-reduction policy is actually working at the local level. The authors recognized that human activity leaves a digital and physical footprint that can be seen from space, specifically through Nighttime Light (NTL) and urban infrastructure patterns.
Methodology: Beyond Just Brightness
While previous studies focused heavily on NTL, this work argues that spatial context matters just as much. The authors engineered a feature set comprising:
- NTL Statistics: Mean, sum, and standard deviation of radiance.
- Proximity: Euclidean distance to Bangkok and Chiang Mai (the economic engines).
- Density: Population density (WorldPop) and Road density (OpenStreetMap).
The pipeline involved a transition from Regression (to prove correlation) to Discretized Classification. Using K-Means clustering, the median income was split into three tiers: Low, Average, and High.
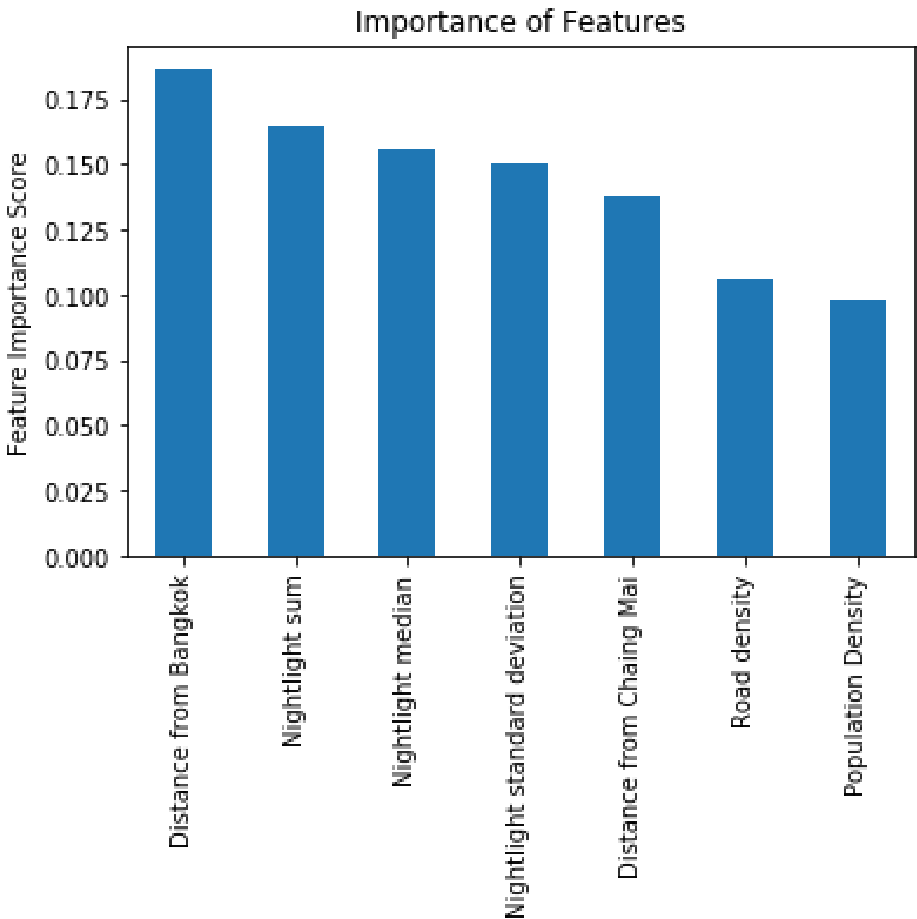 Figure 1: Feature importance showing that distance from the capital is the strongest predictor of wealth.
Key Insights and Results
The Gradient Boosting Classifier proved highly effective at identifying the extremes.
- Precision for High Income (Level 2): 0.95. If the model says a sub-district is rich, it almost certainly is.
- Recall for Low Income (Level 0): 0.93. The model is excellent at "catching" nearly all poor regions.
The "Bangkok Effect"
One of the most striking findings (as seen in Figure 1) is that Distance from Bangkok outperformed all other features, including nighttime lights. This highlights the extreme economic centralization in Thailand. Conversely, road density was surprisingly less significant, suggesting that in developing contexts, road presence alone doesn't guarantee high median income if other urban services are missing.
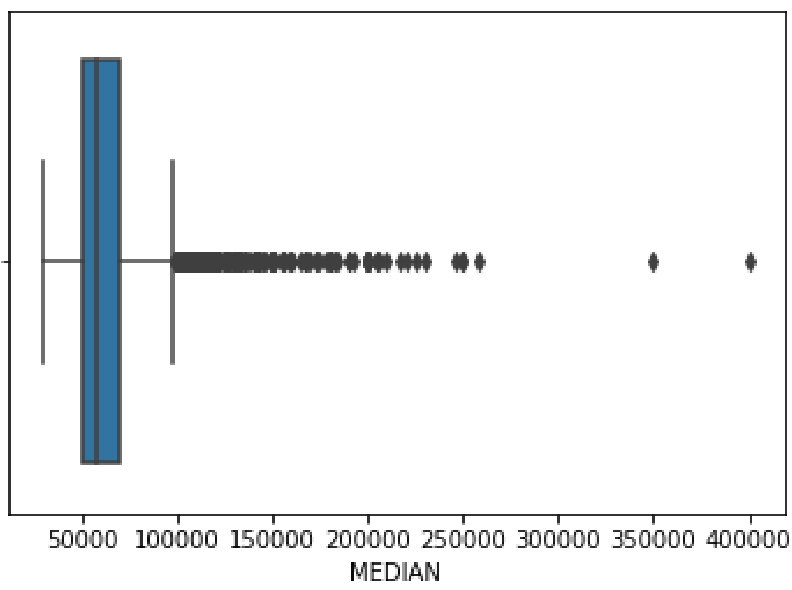 Figure 2: Geographic distribution of actual vs. predicted income. Note the high accuracy in the central plains near Bangkok.
Limitations & The Tourism Variable
The model struggled slightly with Southern Thailand. Many islands there have low nighttime light and are far from Bangkok, yet they boast high median incomes due to international tourism. Since the model didn't include "tourist arrivals" as a feature, it tended to under-estimate these pockets of wealth.
Conclusion: A New Tool for Policy Makers
This paper provides a blueprint for "Low-cost Census." By using freely available data (VIIRS, OSM, WorldPop), governments can generate annual or even quarterly estimates of poverty and wealth distribution. The next frontier, as the authors suggest, lies in Computer Vision—using high-resolution daytime satellite imagery to identify building materials, roof types, and swimming pools to further refine these economic estimates.
Takeaway for Researchers
If you are working on socioeconomic modeling, don't just rely on NTL. Geospatial topology (the distance to hubs) and Population density are essential inductive biases that significantly boost model performance in centralized economies.