
Bridging Regressions and Indicators: A Comprehensive ML Platform for Stock Recommendations
A Machine Learning Platform for Stock Investment Recommendation Systems
This paper presents a comprehensive machine learning platform designed for stock investment recommendations, specifically targeting the Spanish continuous market. It integrates data extraction via the custom-built 'investpy' library with multiple regression algorithms and technical analysis indicators to generate actionable buy/sell signals.
TL;DR
Predicting the stock market is a balancing act between quantitative forecasting and historical pattern recognition. This paper introduces a specialized Machine Learning platform that bridges this gap by combining five core ML regression models with traditional Technical Analysis (TA). By leveraging a custom-built data extraction tool called investpy, the system provides non-expert users with transparent buy, hold, or sell recommendations based on the Spanish continuous market.
Background Positioning
In the landscape of AI-driven finance, most research oscillates between "Black Box" deep learning models and purely heuristic-based trading. This work sits in the middle—it is an Engineering-centric SOTA application that focuses on the synergy between data reliability (via custom scraping) and multi-factor validation (via technical indicators).
The Core Challenge: Data Latency and Model Complexity
The authors identify that even the best Artificial Neural Networks (ANNs) fail if the input data is inconsistent or if the model doesn't account for market momentum. The primary pain points addressed are:
- Data Acquisition: The difficulty of legally and efficiently extracting historical data from sources like Investing.com.
- Interpretability: Bridging the gap so that a "Predicted Closing Price" is translated into a meaningful recommendation (Buy/Sell).
Methodology: The Hybrid Architecture
The platform’s intelligence is bifurcated into two streams: ML Regression and Technical Momentum Calculation.
1. The ML Regression Suite
Instead of relying on a single model, the platform employs a "Diversity of Thought" approach using:
- Random Forest & Gradient Boosting: For handling non-linear relationships and reducing variance.
- MLP Regressor: To capture complex patterns via backpropagation.
- SVR & KNN: To provide baseline linear and distance-based predictions.
2. The Technical Indicator Engine
The ML predictions are not used in a vacuum. They are cross-referenced with momentum indicators:
- Relative Strength Index (RSI) and Stochastic Oscillator (STOCH): To detect overbought or oversold conditions.
- Ultimate Oscillator (ULTOSC): Using a weighted average of three different timeframes to filter out "noise" and false signals.
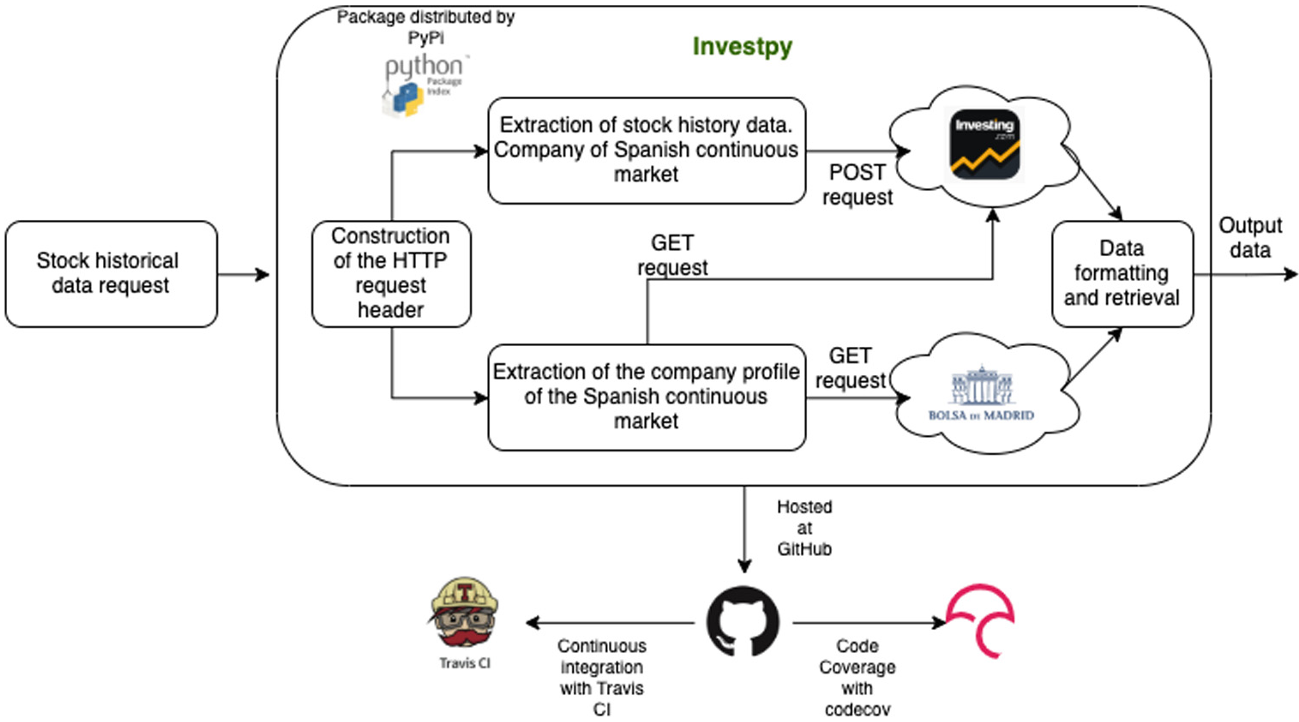 Fig 1: The workflow of data extraction and ML application within the system.
Experiments and Visualization
The researchers optimized the data pipeline by testing various web-scraping combinations, concluding that requests-lxml provided the highest efficiency for historical parsing.
The visualization platform represents the final "User Layer," where complex OHLC (Open-High-Low-Close) data is converted into:
- Candlestick Charts: For visual volatility analysis.
- Recommendation Summaries: A simplified Buy/Sell output derived from the comparison of the ML-predicted closing value and current indicators.
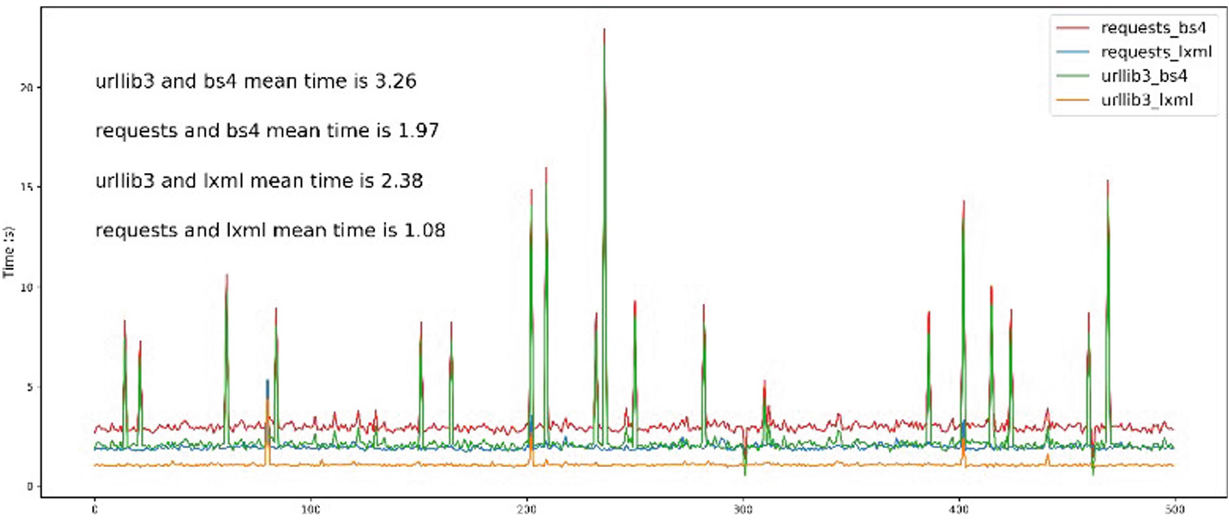 Fig 2: Performance analysis of different scraping libraries used in the
 investpy development.
Critical Insight: Why This Model Works
The success of this platform lies in its Inductive Bias. By forcing the system to calculate Moving Averages (SMA/EMA) over 5 to 200-day windows, the authors ground the "fluctuation-heavy" ML predictions in long-term market trends. This prevents the model from overreacting to daily volatility.
Conclusion & Future Outlook
The platform serves as a blueprint for localized market analysis (Spain). However, the real takeaway is the transparency of the recommendation process. By making the prediction and indicators visible to the user, it moves away from "Trust the AI" toward "Verify with Data."
Limitations: The current model lacks NLP capabilities—it cannot "read" the news or market sentiment. The authors suggest that adding Natural Language Processing to monitor social media and financial reports will be the next frontier for this platform.
Future Work: Expanding the investpy package to global markets and integrating GridSearchCV across all asset classes will further solidify the platform's robustness.