
Deciphering the Aging Connectome: A Machine Learning Approach to Whole-Brain Networks
Identifying population differences in whole-brain structural networks: A machine learning approach
This paper introduces a machine learning framework for classifying whole-brain structural connectivity patterns using diffusion MRI. By combining probabilistic tractography between 83 automated regions with a PCA-MLDA (Maximum Uncertainty Linear Discriminant Analysis) classifier, the study successfully distinguishes between young (20–30 yrs) and elderly (60–90 yrs) populations with 87.46% accuracy.
TL;DR
Researchers at Imperial College London developed a machine learning pipeline that transforms raw Diffusion MRI data into a "structural fingerprint" of the brain. Using a combination of probabilistic tractography and Maximum Uncertainty Linear Discriminant Analysis (MLDA), the system can classify the age of a subject with nearly 90% accuracy and pinpoint exactly which neural "cables" are degrading or remaining resilient over time.
Background: Beyond Voxel-Counting
In the quest to understand brain aging and disease, we have historically relied on two extremes:
- Voxel-based Morphometry (VBM): Measuring how the "volume" of brain regions shrinks.
- Graph Theory: Measuring abstract properties like "path length," which often loses the physical location of the changes.
This paper bridges the gap. It asks: Can we look at the brain as a complete wiring diagram—a connectome—and use machine learning to find the most significant changes between populations?
Methodology: Building the Wiring Diagram
The workflow is a multi-step engineering feat that ensures the final data is physiologically meaningful.
1. Robust ROI Segmentation
The authors use 83 regions of interest (ROIs). To avoid the noise of individual brain variation, they use a "multi-atlas" approach. Labels from multiple templates are propagated to the subject and fused, ensuring that the seed and target points for tractography are highly accurate.
2. Directional Anisotropy, not just volume
A critical insight was the avoidance of simple "Fractional Anisotropy" (FA) or "Connection Probability." Probabilities often drop simply because a brain region has shrunk (atrophy). Instead, they derived a mean anisotropy () from Orientation Distribution Functions (ODFs). This measures the "density" and "integrity" of the fibers themselves, regardless of how large the tract is.
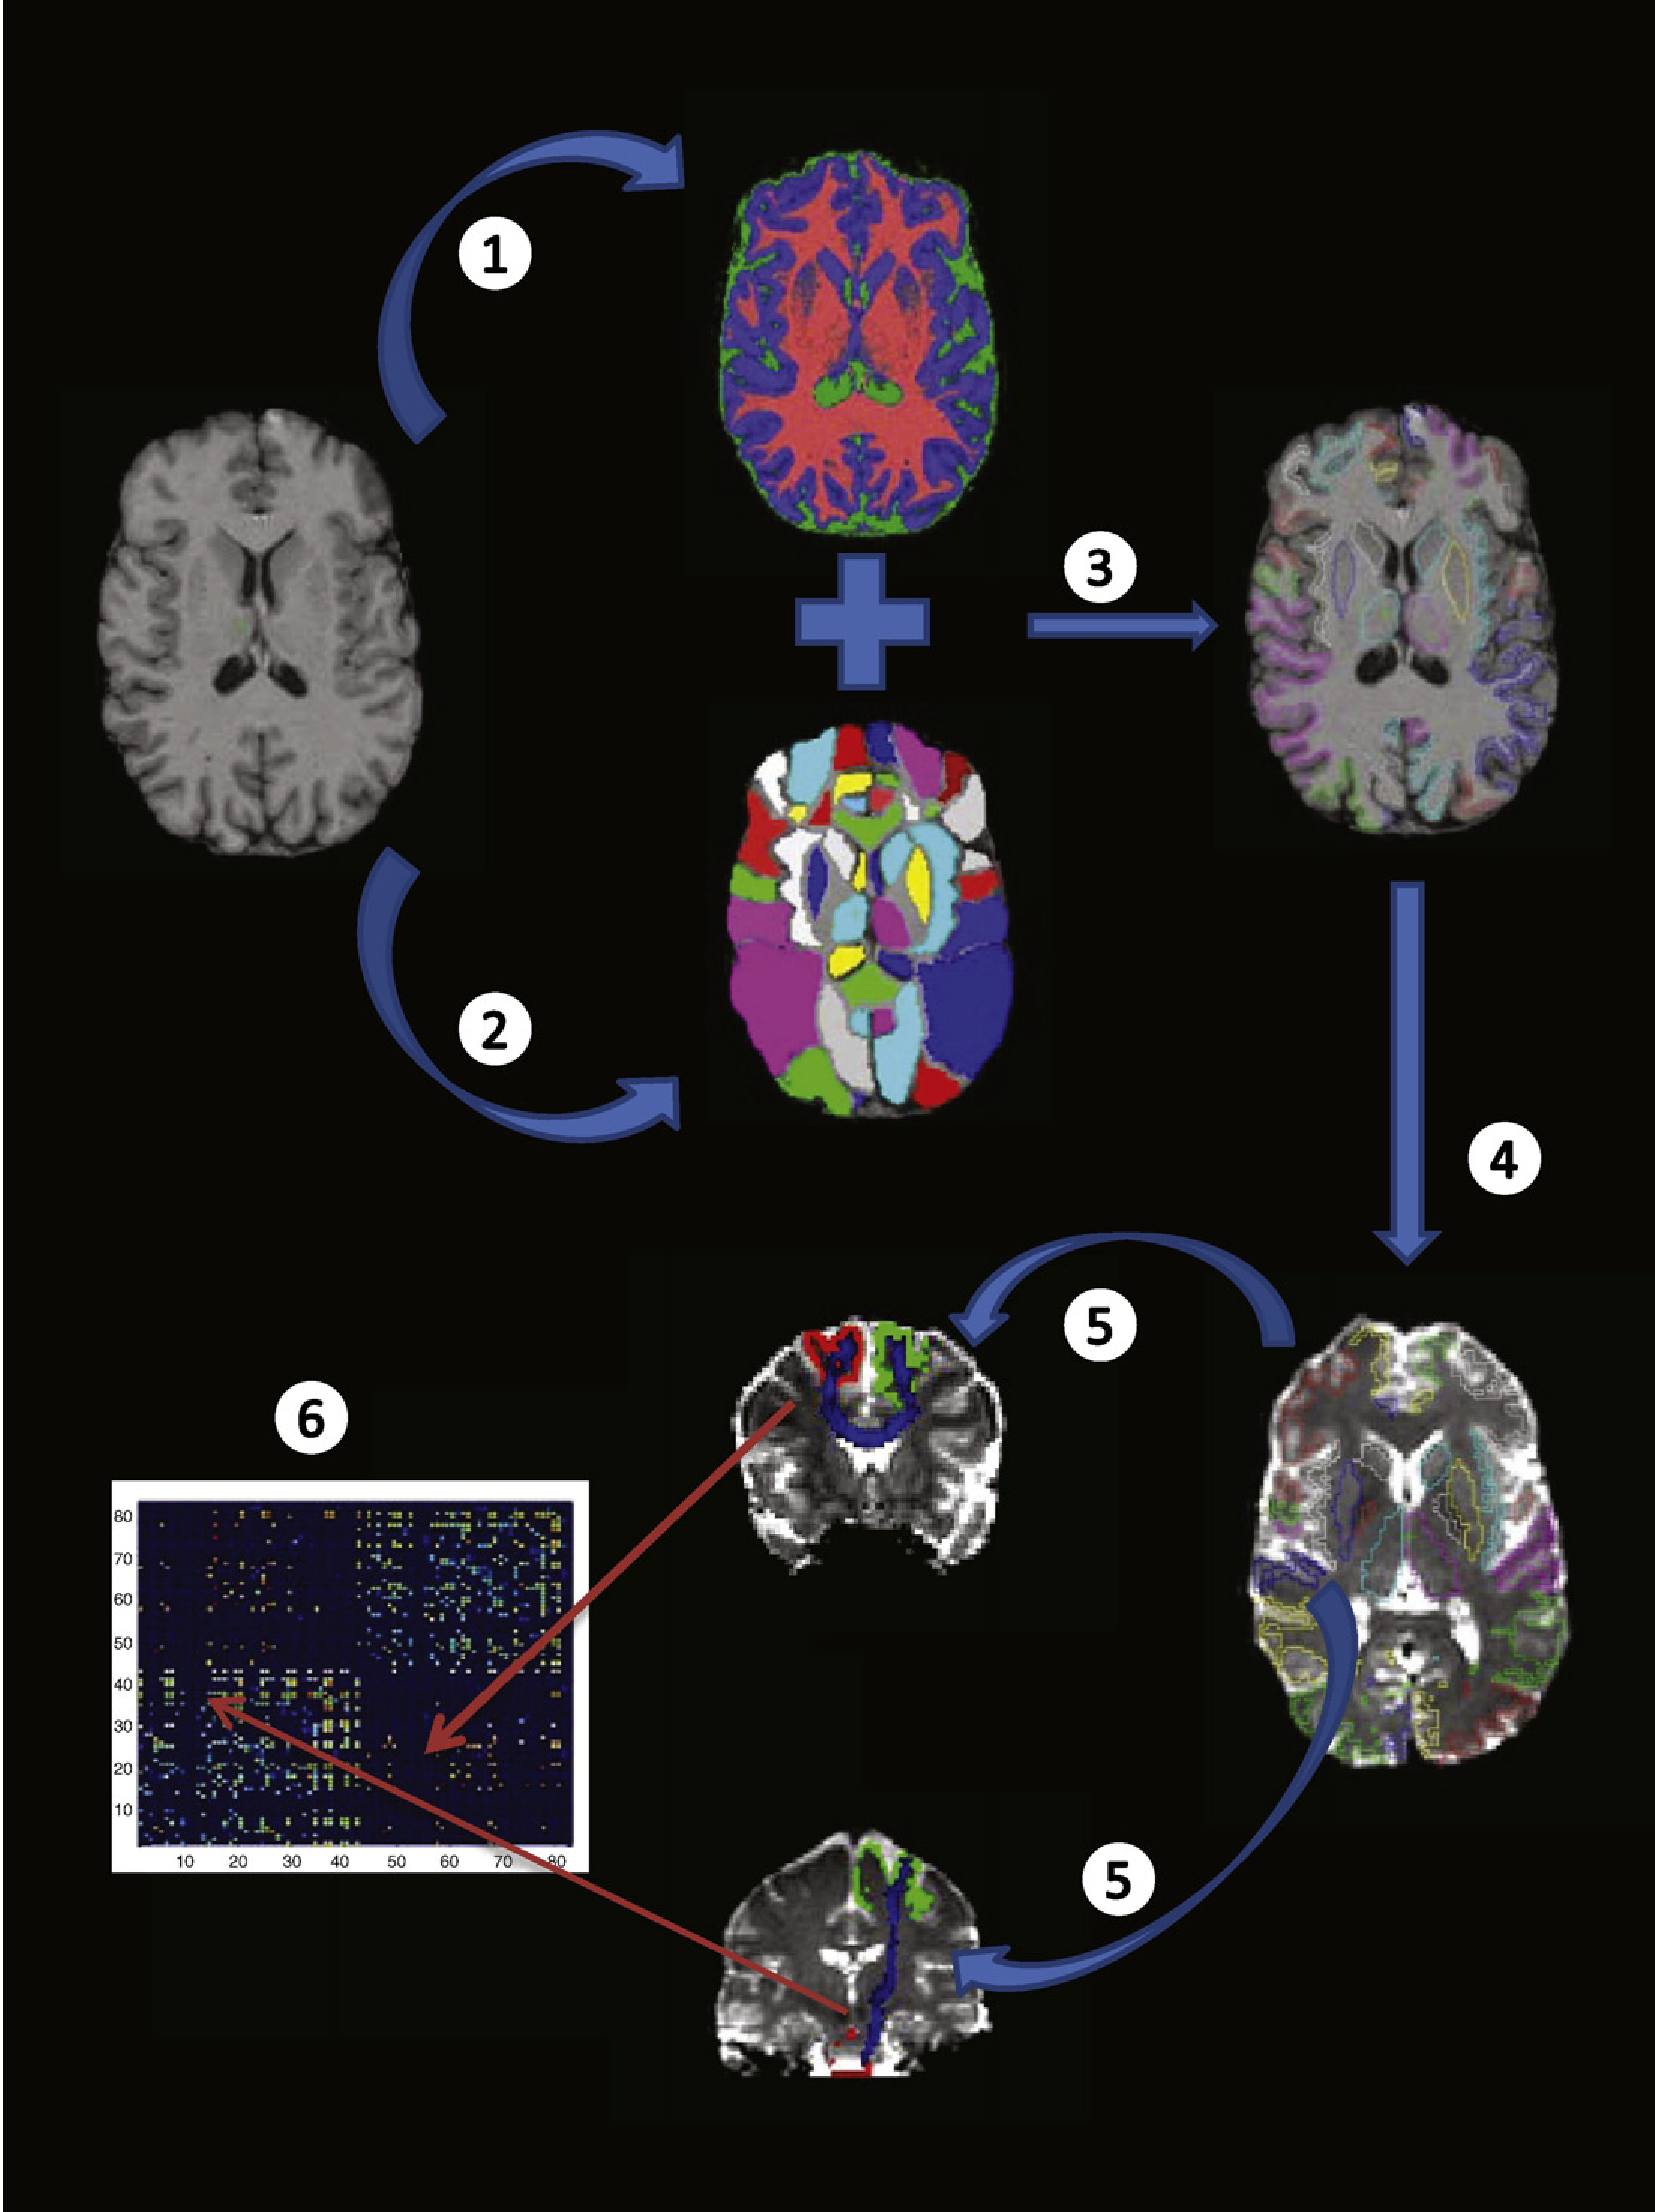 The workflow: from T1/Diffusion MRI to 83x83 Connectivity Matrices.
3. PCA + MLDA: The Classifier
With thousands of possible connections but only 96 subjects (The "Small , Large " problem), standard statistics fail. The authors used Maximum Uncertainty LDA (MLDA). Unlike standard LDA, which can become singular or unstable with high-dimensional data, MLDA regularizes the covariance matrix, making the classification robust even for small clinical cohorts.
Results: The Geography of Aging
The model didn't just classify; it explained. By mapping the MLDA hyperplane back into the 3D space of the brain, the authors visualized the "topography of aging."
Key Discoveries:
- The Vulnerable: Major declines were seen in the Substantia Nigra connections to the Caudate and Frontal cortex. This aligns with our understanding of Parkinsonian-style aging and the slowing of motor/executive functions.
- The Resilient: Interestingly, the Splenium of the Corpus Callosum showed relative preservation or even higher anisotropy in the older group, supporting the "last-in, first-out" hypothesis of myelination—where brain structures that develop last (like frontal tracts) are the first to degrade.
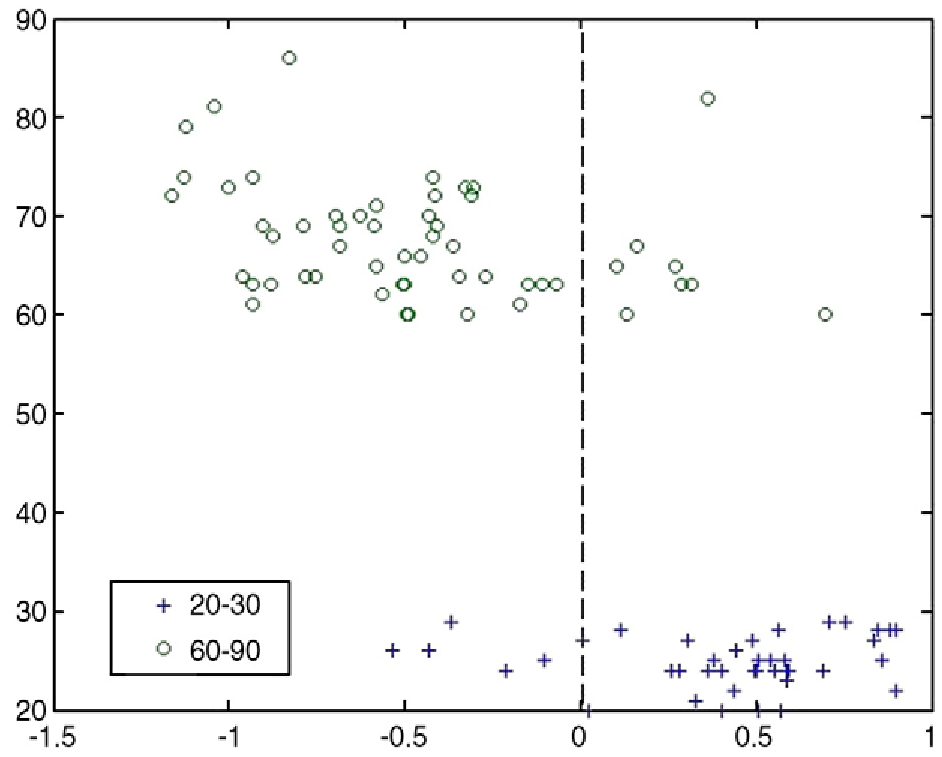 Clear separation between the 20-30 age group and 60-90 age group using the MLDA distance metric.
Why It Matters: Clinical Future
This approach bypasses the need for "manual ROI selection," which is often biased by a researcher's hypothesis. It is an unbiased, whole-brain search engine for pathology.
Limitations: The study used 15-gradient direction data—a clinical standard in 2010 but "low-res" by today's standards. Modern High-Angular Resolution Diffusion Imaging (HARDI) would likely sharpen these results further by resolving "crossing fibers" in complex white matter areas.
Conclusion
By treating the brain as a high-dimensional network and applying tailored ML classifiers, we can move from "observing" aging to "predicting" and "mapping" it. This framework sets a blueprint for future diagnostic tools that could identify neurodegeneration years before macrostructural atrophy becomes visible on a standard MRI scan.