
Visualizing Evolution: A Macro-Level Framework for Privacy-Preserving Social Network Analysis
Modeling and Analysis of Social Network Dynamics on the Macro-Level in View of the Customer-Centric Concept
This paper introduces a two-level monitoring framework for social network analysis, focusing on a macro-level approach that detects evolutionary changes through visual graph structures. By treating network states as visual "layers" and comparing cluster characteristics like area and density, the model identifies significant shifts in user behavior without requiring access to private personal data.
TL;DR
In an era of strict data privacy and overwhelming information velocity, how can companies stay "customer-centric" without snooping on individual users? This research proposes a two-level approach that treats social networks as evolving visual layers. By monitoring the "area" and "density" of activity clusters at a macro-level, the system can automatically flag significant "evolutionary points" for deeper analysis, providing a high-speed, privacy-first alternative to traditional data mining.
Background: The Customer-Centric Dilemma
Modern marketing demands high agility—the ability to pivot based on social trends. However, researchers face two major hurdles:
- Legal Boundaries: Personal data protection laws make it difficult to scrape individual profiles.
- Scale: Social networks are simply too large for continuous, detailed graph-wide monitoring.
The authors shift the focus from the individual to the crowd. By observing the macro-dynamics of openly published data, companies can observe social "reactions" to topics rather than tracking the people behind them.
Methodology: The Macro-Level "Spot" Analysis
The core innovation lies in the Macro-Level functionality. Instead of calculating complex graph metrics (like betweenness centrality) for every node, the framework treats the network as a visual image composed of clusters or "spots."
Logic of Metric Comparison
The system compares a current state to a "standard layer." A change is detected if:
- Cluster Count (): New groups of interest emerge or old ones merge.
- Density (): The concentration of activity within a cluster increases (the "spot" gets darker).
- Area (): The influence or reach of a topic expands (the "spot" gets larger).
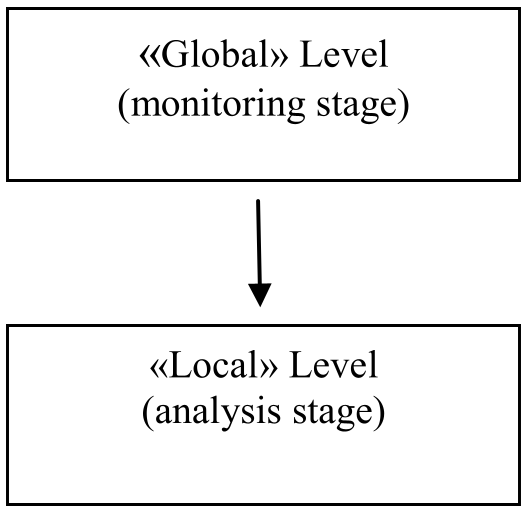
The logic function acts as a binary trigger. If , an evolutionary change has occurred, and the system signals the Micro-Level to perform a deep-dive investigation into the specific causes.
Analytical Insights: From Formulas to Intuition
The authors define the network state using a matrix , where each column represents a cluster characterized by area, density, and color. By building an intersection of matrices between time and , they calculate the sum of differences ().
Mathematically, if , the change is considered statistically significant. This heuristic is elegant because it abstracts away the "noise" of individual edge changes, focusing only on the "signal" of collective behavior.
Experiments & Practical Interpretation
To test this, a software complex was developed to analyze graph visualizations. The system successfully:
- Identified and highlighted new clusters automatically.
- Differentiated between minor fluctuations and "evolutionary layers."
- Operated entirely on visual "schematic interpretations," preserving lower-level data privacy.
(Note: While the paper focuses on the conceptual framework, the test complex demonstrated that focusing on cluster area and density is sufficient for tracking hashtag concentrations and "crowd" movement.)
Critical Analysis & Future Outlook
Takeaway: This work proves that "less is more." By moving away from node-level data, we gain speed and legal compliance without losing the ability to track major social shifts.
Limitations:
- The paper assumes cluster shapes can be simplified (like ellipses), which may not hold true for highly fragmented or "long-tail" social networks.
- The selection of thresholds () is subjective and likely requires domain-specific tuning.
Future Work: Integrating this framework with State Space Models (SSM) or Dynamic Graph Neural Networks could further refine the "Macro" trigger, making the detection of evolutionary points even more predictive rather than just reactive.
Conclusion
For the modern CMO or Data Architect, this approach offers a strategic path forward: monitoring the "forest" (macro-clusters) to decide when it's worth sending a team to inspect the "trees" (micro-level details).