
Malware in Social Networks: Why Your "Active" Friends are More Dangerous Than Your "Popular" Ones
Malware propagation in online social networks: nature, dynamics, and defense implications
This paper presents a comprehensive study of malware propagation in Online Social Networks (OSNs) using a real-world dataset from BrightKite. It identifies how social topology and user activity patterns—modeled via trace-driven simulations—interact to facilitate or hinder the spread of worms, achieving a detailed mapping of OSN epidemic dynamics.
TL;DR
While we often fear social network worms as unstoppable forces of nature, their "biological" success depends less on how many friends you have and more on how often you check your feed. This study uses real-world traces from BrightKite to prove that user activity patterns—specifically the stretched exponential distribution of logins—act as the primary throttle for malware propagation.
Context: The Social Epidemic
Unlike traditional Internet worms (like Code Red) that scan IP addresses, OSN malware like Koobface or MySpace.A exploits human trust. They spread through direct messages and wall posts. However, a virus cannot spread if the recipient never logs in to click the link. This research bridges the gap between static graph theory and the messy reality of human behavior.
The "Activity" Bottleneck
The authors uncover a crucial insight: while OSNs are scale-free (a few "hubs" have most of the friends), they are also characterized by highly skewed activity levels.
- The Stretched Exponential Law: Most users are casual, while a tiny "active elite" generates the majority of traffic.
- Weak Correlation: A high friend count does not strictly mean a high activity level.
This means if a worm infects a "popular" user who hasn't logged in for a month, the infection chain breaks.
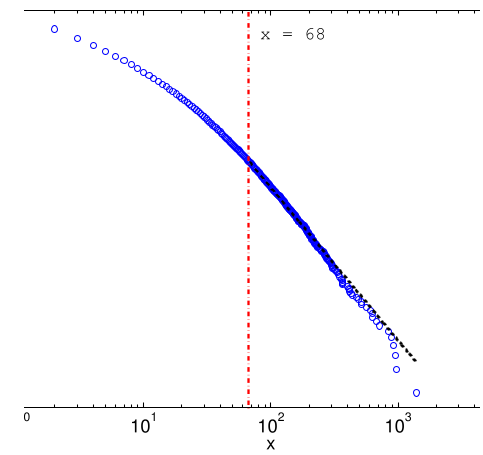 Figure: The Skewed nature of user out-degrees and connected components.
Simulation Insights: The SI Model in Action
Using a trace-driven simulation, the authors tested how a worm behaves when it hits a network where users only become "susceptible" during their actual check-in events.
Key Findings:
- The Power of Active Neighbors: An attacker gains more from infecting a node with 10 active friends than a node with 100 inactive friends.
- Social Engineering is King: Increasing the "Click Probability" (through better phishing) has a non-linear impact on the speed of the initial take-off.
- Early-Stage Momentum: OSNs' highly clustered "Small World" nature allows worms to saturate local clusters almost instantly before jumping to the global population.
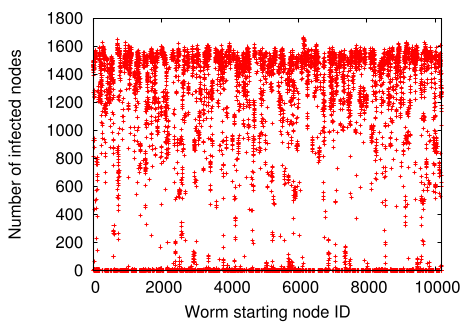 Figure: Malware propagation over time, showing the "bimodal" outcome of infection.
Defensive Strategies: Can We Stop the Spread?
The paper compares two main defensive philosophies:
1. User-Oriented Defense (The "Vaccine" Approach)
When a user finds they are infected and "recovers," they send warning messages to friends.
- Finding: This is only effective if the "Detection Period" is extremely short (under 24 hours). If the worm gets a head start of a week, even a 100% recovery rate won't stop the saturation.
2. Server-Oriented Defense (The "Sanitization" Approach)
The OSN provider (e.g., Facebook, X) selectively scans messages for malicious URLs.
- The Hub Strategy: Sanitizing messages from the top nodes by active neighbors is the most efficient way to slow a worm.
- The Island Strategy: Attempting to partition the network into "islands" (Preventive Containment) is surprisingly ineffective. You would have to sanitize nearly 80% of all edges to contain a worm within 10% of the network.
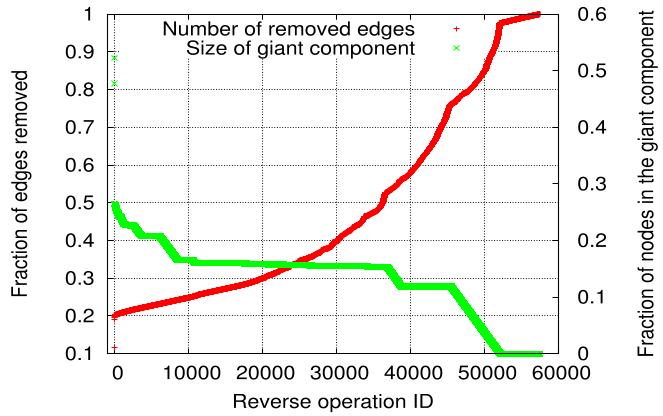 Figure: Comparison of sanitization strategies: Edges vs. Active Neighbors vs. Activity intensity.
Critical Analysis & Takeaways
The most profound takeaway is that human behavior is the ultimate firewall. The "short active time span" of many users actually helps protect the network by creating natural air-gaps.
Future Implications: For security architects, the goal shouldn't be to protect every node equally. Instead, identify the "Active Hubs"—those who have both high degrees and high activity—and prioritize their message sanitization. For researchers, this paper serves as a reminder that a graph without "time" is only half of the story.