
Mapping the Andean Harvest: How ICESat-2 LiDAR and ML are Transforming Agriculture in Ecuador
Mapping the Diversity of Agricultural Systems in the Cuellaje Sector, Cotacachi, Ecuador Using ATL08 for the ICESat-2 Mission and Machine Learning Techniques
This research develops a precise agricultural mapping framework for the Seis de Julio de Cuellaje (SDJC) sector in Ecuador by integrating ICESat-2 ATL08 LiDAR data with Landsat-8 imagery. It utilizes Machine Learning (specifically Random Forest) to classify crop systems and estimate canopy height, achieving a SOTA classification accuracy of 95.57%.
Executive Summary
TL;DR: This study presents a robust framework for mapping agricultural diversity in the Cuellaje sector of Ecuador by leveraging NASA’s ICESat-2 satellite data. By fusing photon-counting LiDAR (ATL08) with Landsat-8 multispectral imagery and Machine Learning, the researcher achieved a 95.57% classification accuracy, enabling precise monitoring of high-value crops like tree tomato and passion fruit.
Positioning: This work represents a significant shift from traditional 2D spectral remote sensing to 3D structural analysis in agricultural cartography, specifically targeting the complex, high-altitude terrains of the Andes.
Problem & Motivation: The "Blind Spot" in 2D Mapping
In the rural parish of Seis de Julio de Cuellaje (SDJC), farmers face a persistent challenge: a lack of technical knowledge regarding weather and soil suitability. While satellites like Landsat have long provided "top-down" views, they often view the world in 2D.
The limitation of prior work lies in the inability to distinguish between crops that look similar from a spectral standpoint but differ vastly in vertical structure and biomass. Without Canopy Height data, estimating carbon sequestration and crop maturity remains a guessing game. The author's insight was to use ICESat-2's ATLAS instrument—a laser altimeter—to "slice" through the canopy and measure the true height of the vegetation.
Methodology: Fusing Photons with Pixels
The core of the methodology lies in the processing of the ATL08 (Land and Vegetation) product.
1. The LiDAR Advantage
The ATLAS instrument on ICESat-2 uses a 532-nm laser wavelength, firing pulses that allow for measurements every 0.7m along the satellite's path. The author utilized the DRAGANN (Differential, Regressive, and Gaussian Adaptive Nearest Neighbor) algorithm to filter out noise photons and isolate those bouncing off the ground and those hitting the top of the crop canopy.
2. Machine Learning Fusion
The retrieved canopy heights were integrated with:
- NDVI (Normalized Difference Vegetation Index) from Landsat-8.
- DEM (Digital Elevation Model) data.
- Random Forest (RF) Regression/Classification: A supervised model trained to map these features to specific crop types and Above Ground Biomass (AGB).
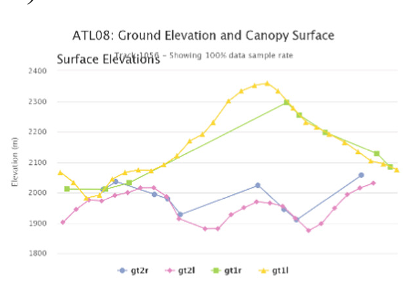 Figure: ICESat-2 ATL08 transects illustrating track alignment over the study site and the resulting 3D photon cloud.
Experiments & Results
The study focused on three specific ecosystems: Montane evergreen forest, piemontan forest, and xerophilous montane scrub.
- Classification Performance: The Random Forest model achieved a staggering 95.57% accuracy.
- Structural Insight: The methodology successfully separated ground elevation from canopy surface, a critical step for precision farming in "rolling terrain" where traditional elevation models are often too coarse.
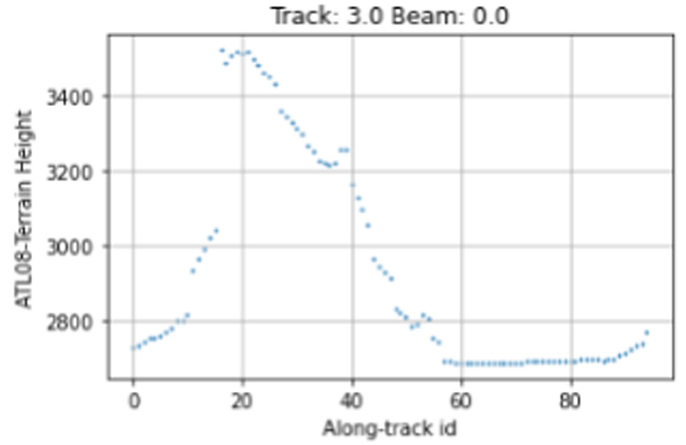 Figure: Visual analysis of ATL08 canopy heights plotted against relative height metrics in the SDJC region.
The research utilized the icepyx Python library for data discovery, ensuring a modern, reproducible pipeline using the NSIDC API.
Critical Analysis & Future Outlook
Takeaway
The integration of ICESat-2 demonstrates that structure is as important as spectrum. By knowing the "height" of a crop, decision-makers can better predict yields and manage ecosystem services.
Limitations
- Outline Precision: The author notes that the outlines of ground objects in the final classification are not yet perfect compared to ground truth.
- Point Cloud Density: In dense tropical canopies, the ratio of canopy photons to total signal photons can bias height estimates, requiring more refined filtering.
Future Work
The next frontier involves applying Convolutional Neural Networks (CNN) to this 3D data. As high-resolution satellite data becomes more affordable, the "Strategy/Scheme" proposed here could be scaled globally to support the United Nations' food productivity and sustainability goals.
Disclaimer: This blog post is a technical reconstruction based on the paper by Garrido Fernando (Technical University of the North).