
Mapping the Media Universe: How Social Data Creates a Geometric Space for Discovery
Mapping the Media Universe Using User-Generated Data in Online Social Networks
This paper introduces the "Map of Media," a high-dimensional Euclidean embedding of movies and TV shows derived from user activity on the social network tvtag. By applying the Isomap algorithm to a co-occurrence graph of user likes, the authors create a data structure that enables constant-time (O(1)) similarity retrieval and achieves state-of-the-art intuitive organization of media content.
Executive Summary
TL;DR: This research transforms the chaotic world of social media check-ins and likes into a structured, multi-dimensional "Map of Media." By embedding over 14,000 titles into a Euclidean space using the Isomap algorithm, the authors enable local similarity discovery that is both computationally efficient ((O(1)) lookup) and mathematically rigorous.
Background: Positioned at the intersection of Social Computing and Information Retrieval, this work moves beyond simple collaborative filtering. It treats media similarity not as a list of "people also liked," but as a physical manifold where distance, direction, and volume define our relationship with content.
Problem & Motivation: The Failure of Linear Playlists
We are drowning in content, yet our discovery tools remain primitive—limited to alphabetical grids or generic "Trending" rows. The core technical challenges addressed here are:
- Subjectivity: Similarity is personal. How do we extract a universal "distance" from millions of individual preferences?
- Scalability: Graph-based similarity models are memory-intensive. Calculating the shortest path between distant nodes in a 14,000-node graph is too slow for mobile apps.
The authors' insight was that co-occurrence in social histories acts as a proxy for latent similarity. If thousands of users "like" both The Big Bang Theory and Community, there is a geometric pull between these two points in the cultural landscape.
Methodology: The Geometry of a "Like"
The construction of the Media Map follows a sophisticated three-step pipeline:
- Cosine Similarity: Using data from the (now-defunct) social network tvtag, the authors used the cosine coefficient to calculate similarity between items, effectively normalizing for popular titles that might otherwise skew the data.
- Graph Construction: A weighted graph was built where an edge (1 - cosine similarity) connects items with at least two shared likes. This produced a giant connected component of 14,144 nodes.
- Manifold Embedding (Isomap): To reduce this massive graph into something usable, the authors used Isomap. This algorithm calculates all-pairs shortest paths (using Dijkstra) and then applies Classical Multidimensional Scaling (MDS) to map them into 2D, 5D, or 10D spaces.
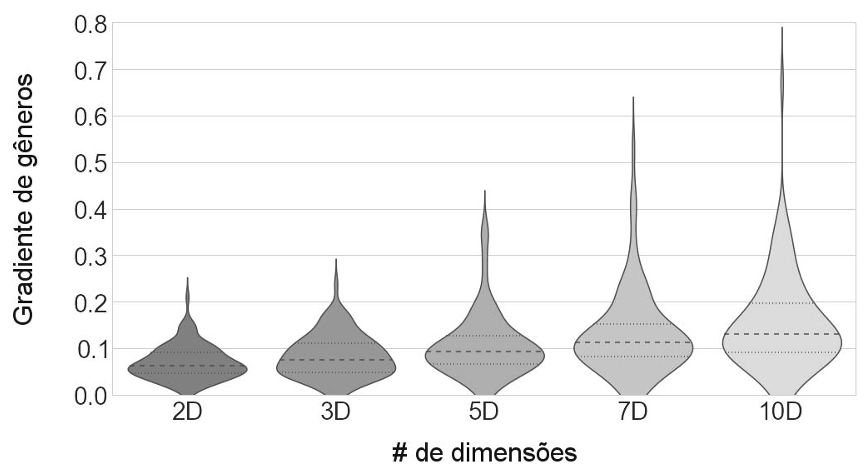 The visualization above demonstrates how the map handles genre gradients—showing that as we move through the space, content types shift smoothly rather than abruptly.
Experiments: Why More Dimensions Matter
The paper provides a fascinating look at the "Curse vs. Blessing of Dimensionality."
- The Quantitative View: Using TMDB metadata as a "ground truth," the authors showed that higher dimensions (10D) produce "smoother" transitions. In a 10D map, the neighbors of a show are much more likely to share its specific sub-genre than in a 2D map.
- Expert Analysis: The authors collaborated with TV experts to verify the map. For instance, in a 2D map, Parks and Recreation was surrounded by generic animated films like Ice Age. However, in the 10D map, it correctly clustered with "Smart Comedies" like 30 Rock and Community.
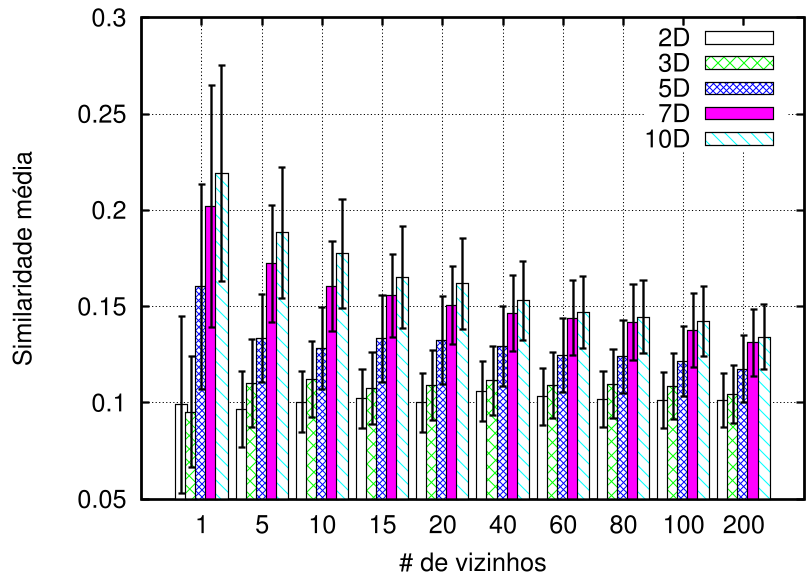 Figure: The "Violin Plot" shows that the gradient of genre similarity becomes significantly smoother and more consistent as dimensionality increases.
Critical Analysis & Conclusion
Takeaway
The "Map of Media" is more than a recommendation engine; it is a navigation infrastructure. By assigning Euclidean coordinates to every movie, developers can build apps where "searching" is as simple as moving a cursor toward a specific "cluster" of interest.
Limitations
- Cold Start Problem: The method relies on co-occurrence. New or obscure films with no "likes" cannot be mapped.
- Temporal Stability: Cultural tastes change. A map built in 2012 (the era of The Walking Dead and Glee) might not accurately reflect the "distance" between genres today.
Future Outlook
This work lays the groundwork for "Trajectory-based Navigation." Imagine an interface where you select The Matrix and The Notebook, and the system calculates a "Inter-genre Trajectory" that recommends movies that bridge the gap—perhaps high-concept sci-fi romances. The transition from lists to manifolds is the next frontier of the user experience.