
Digital Cartography of Poverty: Machine Learning and Satellite Imagery in Accra
Mapping Poverty and Slums Using Multiple Methodologies in Accra, Ghana
This paper presents a multi-methodological approach to map slums and estimate neighborhood-level poverty in Accra, Ghana, by integrating high-resolution Quickbird-2 satellite imagery, census data, and household surveys. Using a Random Forest machine learning model and small-area estimation techniques, the authors produced a quantitative Slum Index and high-fidelity poverty maps that reveal the complex relationship between physical living conditions and monetary deprivation.
TL;DR
Researchers have developed a sophisticated methodology to identify slums and estimate monetary poverty in Accra, Ghana, at an unprecedented granular scale. By fusing high-resolution satellite imagery with machine learning, the study moves beyond static "official" maps to reveal that slums are evolving faster than census records can track. A key finding: living in a slum (physical poverty) does not always equate to having no money (monetary poverty), a nuance critical for urban policy.
Background: The Invisible City
In Sub-Saharan Africa, urban populations are surging at 4.5% annually. For city planners, the challenge is often a lack of data; official slum maps are frequently based on decade-old census data. This study positions itself as a bridge between Remote Sensing and Socio-economic Surveying, aiming to provide a real-time, quantitative toolkit for identifying vulnerable populations.
Problem: Why is Mapping Slums So Hard?
The UN-Habitat defines slums based on five indicators (water, sanitation, space, durability, tenure). However, these are "household-level" traits that are invisible from space and difficult to aggregate across heterogeneous urban landscapes. Prior work often missed "new" slums or failed to account for the physical geography—like low elevation and flood risk—that defines informal settlements in Accra.
Methodology: Fusing High-Res Imagery with Random Forests
The authors employed a dual-track methodology:
- Contextual Feature Extraction: Using Quickbird-2 imagery (2.44m resolution), they calculated features like PanTex (built-up presence), HOG (structure orientation), and LSR (line support), which capture the chaotic or dense "texture" of informal settlements.
- Machine Learning Slum Index: They trained a Random Forest model using known wealthy and known slum neighborhoods as anchors. Interestingly, they added Elevation (via Digital Elevation Models) as a feature, recognizing that in Accra, slums gravitate toward flood-prone, low-lying areas.
- Small Area Estimation (SAE): To estimate poverty, they used a Lasso-regularized regression to pick the most predictive variables among 580 candidates, incorporating satellite features to refine the accuracy of consumption estimates.
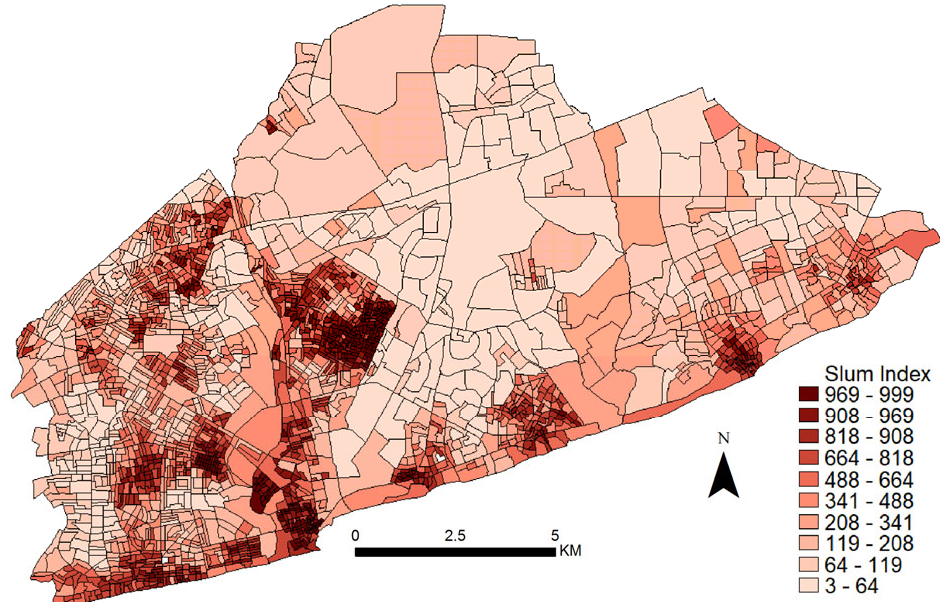 Figure 1: The Machine Learning Slum Map. Areas in red indicate high slum probability, often correlating with low-lying, high-density zones.
Experiments & Results: The "Hidden" Slums
The results were telling. The machine learning model identified 196 enumeration areas that exhibited strong slum characteristics but were missing from official UN-Habitat maps.
- Predictive Power: Adding geospatial variables increased the R² of the poverty model significantly. Specifically, the "LSR" (line lengths) and "HOG" (orientation) features were strong predictors of consumption levels.
- The Slum-Poverty Paradox: Figure 3 shows a wide variance in poverty within slums. While the mean poverty rate is higher in slums, many residents are not below the monetary poverty line. They choose slums for social networks, religious ties, or proximity to urban jobs, despite the lack of private sanitation.
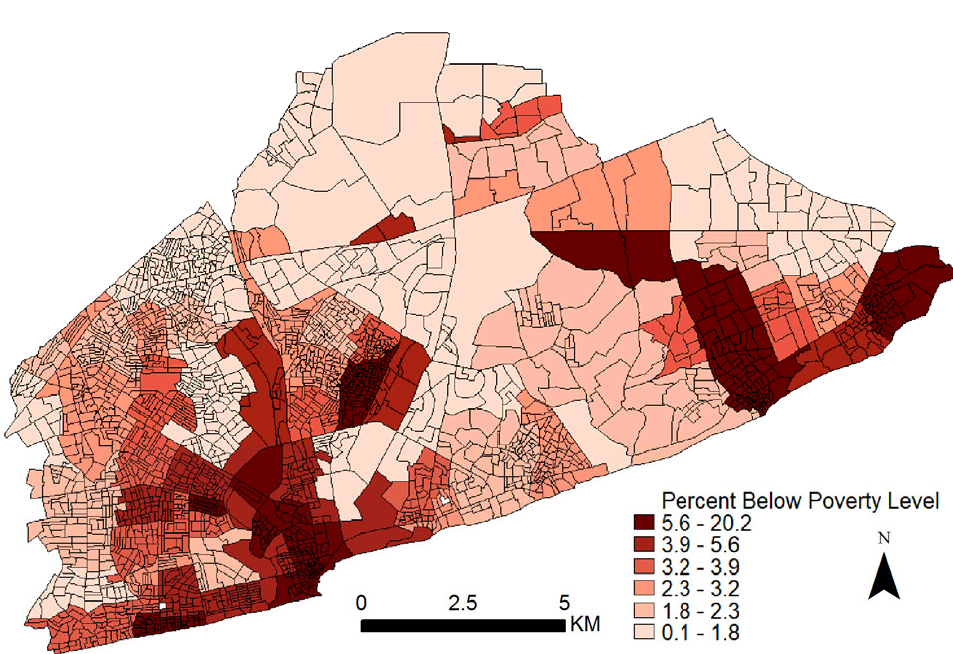 Figure 2: The consumption poverty map at a neighborhood scale. This level of granularity allows for targeted infrastructure investment.
Critical Insight & Future Outlook
The core takeaway is that physical morphology is a proxy for economic reality. Space is the ultimate constraint; in Accra's slums, even wealthy residents often use public toilets because there is physically no room to build private ones.
Limitations: The study was constrained by a small household survey sample (852 observations), limiting the model to 20 variables to avoid overfitting.
Future Work: As satellite revisit times decrease and Deep Learning models (like Vision Transformers) become more accessible, we can expect "Living Maps" that update poverty estimates in near real-time, allowing for rapid response to disasters and more effective urban governance.