
Unmasking the Housing Cycle: Why Unsold Stocks are the Pulse of the Market
Mathematical and Computer Modelling
This study develops a System Dynamics (SD) framework to analyze the cyclical relationship between Unsold New Housing Stocks (UNHS), housing investment, and supply-demand imbalances. By employing Causal Loop Diagrams (CLD) and Stock-Flow Diagrams (SFD), the authors successfully simulate the Korean housing market and establish UNHS as a critical leading indicator for market health.
Executive Summary
TL;DR: This paper argues that the "Unsold New Housing Stock" (UNHS) is the most critical yet underutilized indicator of housing market health. Using System Dynamics, the authors move beyond static statistics to create a living simulation of how unsold houses stifle investment and trigger supply-demand death spirals.
Market Positioning: Published in the wake of the 2008 financial crisis, this work bridges the gap between urban planning and complex systems theory. It transitions UNHS from a "passive result" to an "active driver" in the global academic coordinate system of real estate economics.
Problem & Motivation: The Failure of Static Equations
Why do housing markets crash so violently? Previous research often used regression analysis—one-way equations that say "if X happens, Y will result."
The authors argue this is fundamentally flawed because the housing market is a closed-loop system. An increase in unsold houses doesn't just show the market is bad; it actively makes it worse by:
- Reducing the Return on Investment (ROI) for developers.
- Lowering consumer confidence and price expectations.
- Creating a time-lagged "inventory hangover" that delays recovery for years.
Methodology: Mapping the Invisible Gears
The core of this research is the transformation of qualitative "feelings" (like investment motivation) into quantitative "flows."
1. Causal Loop Diagrams (CLD)
The authors identified four primary loops. The most significant is the Unsold Stock Loop, where high UNHS creates a negative feedback pressure on new housing prices, which in turn reduces the "Expected Return on Capital," further tanking demand.
2. The NUMBER Method
To handle the "Apples vs. Oranges" problem (comparing number of houses to interest rate percentages), the authors used NUMBER (Normalized Unit Modeling by Elementary Relationship). This scales all variables between 0 and 1, allowing the interaction between a developer's survey index (CBSI) and physical housing units to be mathematically modeled in a Stock-Flow Diagram (SFD).
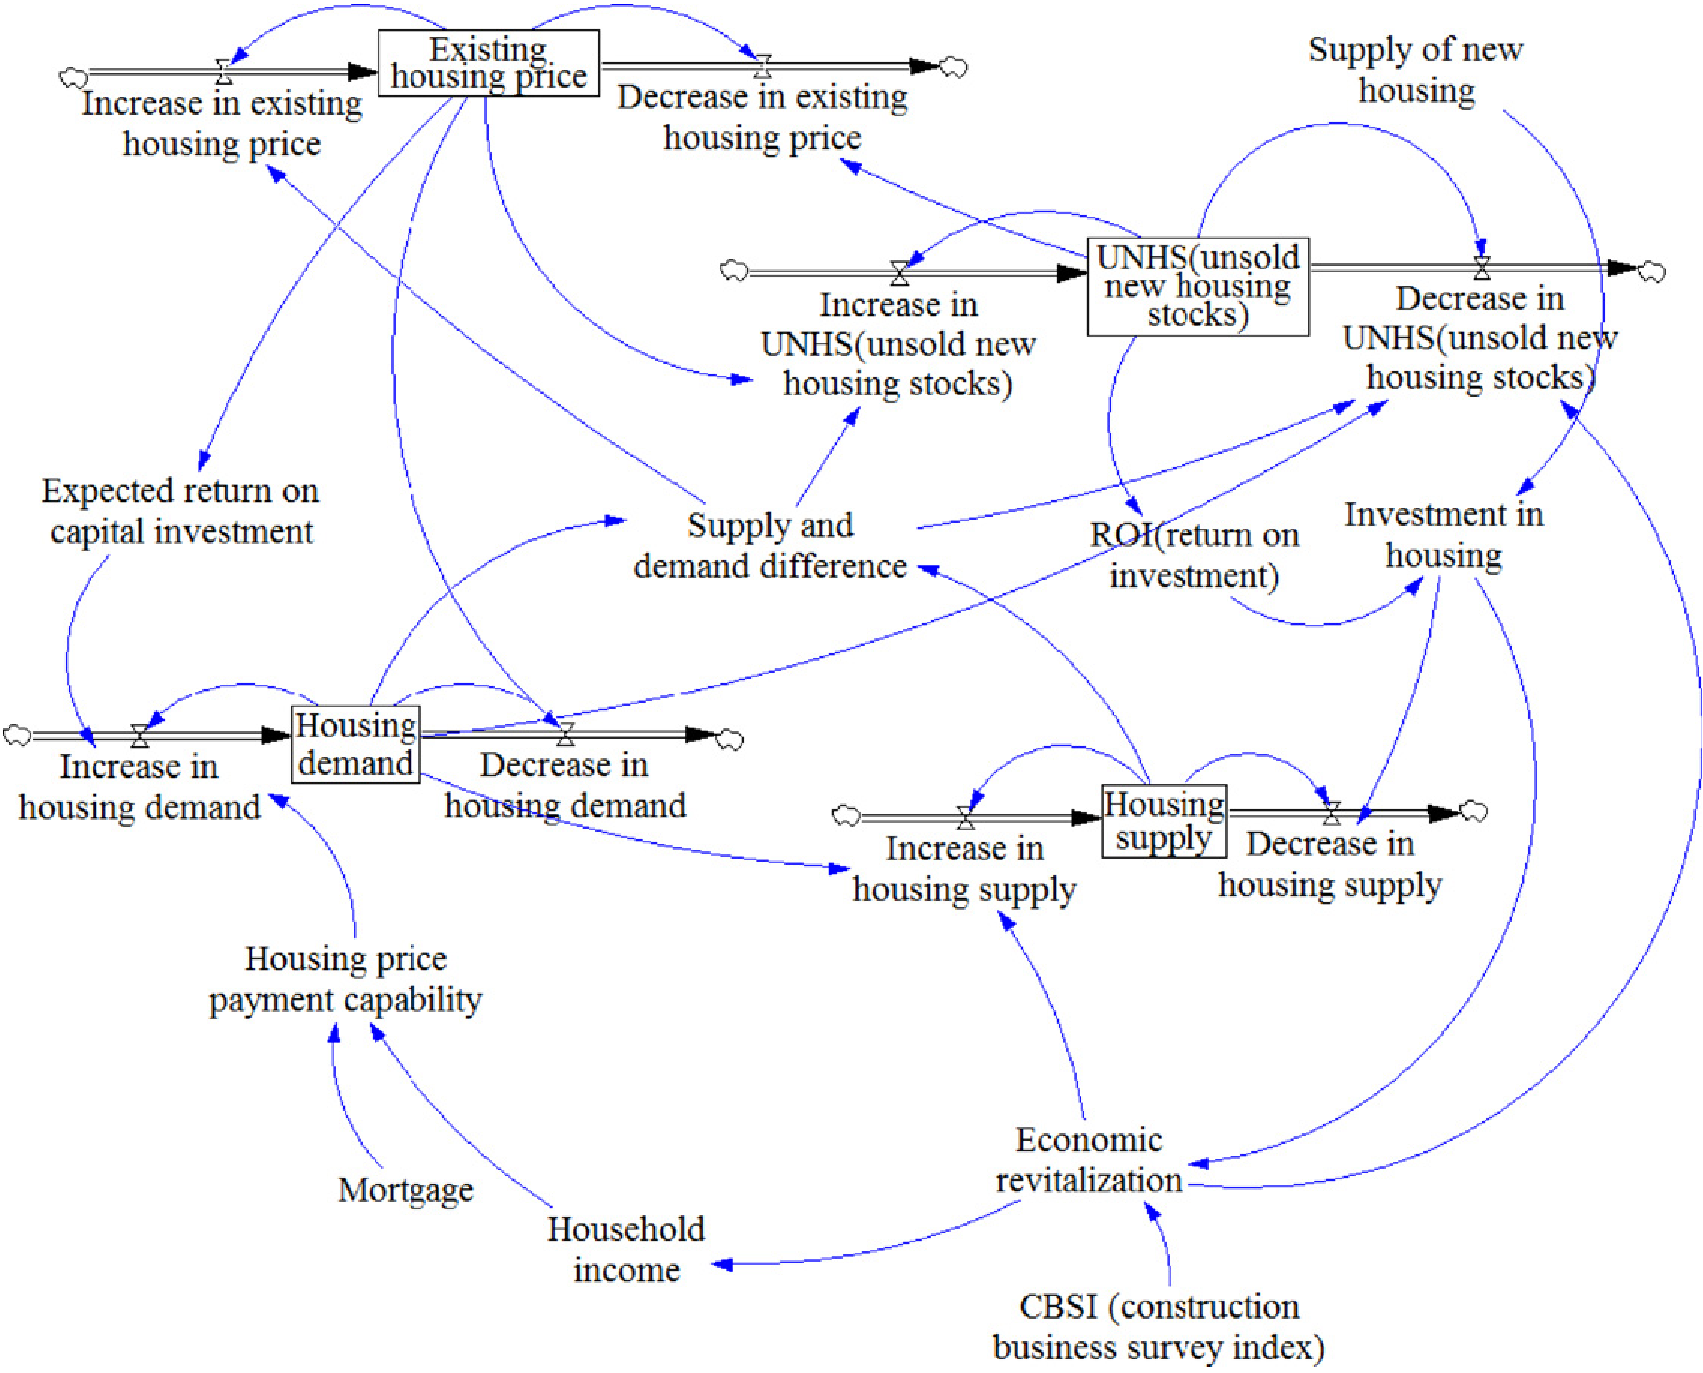 Above: The SFD represents the engine of the housing market, where 'Levels' (Stocks) such as Housing Demand and Supply are regulated by 'Rates' (Flows) influenced by UNHS.
Experiments & Results: A Tale of Two Eras
The model was validated against 2001–2009 Korean market data using the Least Square Method.
- The Golden Fit (2001–2007): The model achieved an of 0.918. It perfectly captured the gradual decrease in UNHS during the 2002 reinvigoration and the steady rise following the 2003 anti-speculation policies.
- The Global Shock (2008–2009): Here, the model broke. The actual UNHS skyrocketed far beyond the simulation's predictions.
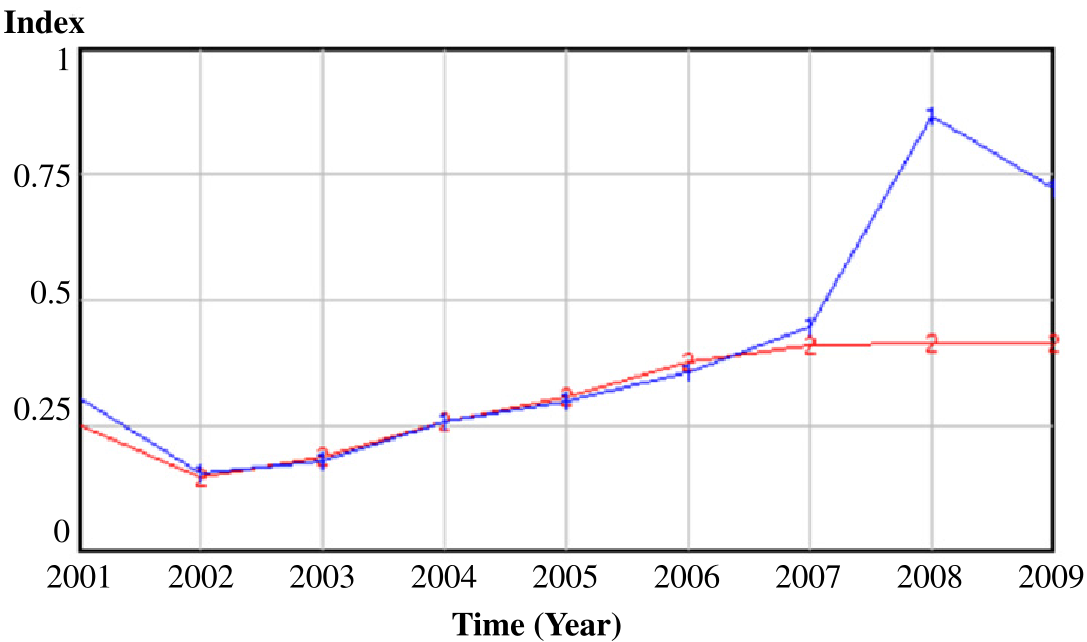 Visual Evidence: Line 1 (Actual) vs Line 2 (Simulation). The divergence in 2008 proves that while internal market logic is cyclical, external shocks (Subprime Crisis) act as "Exogenous Forces" the system cannot yet predict internally.
Critical Insight & Conclusion
The Takeaway
For Developers, the lesson is clear: don't just look at today's prices; look at the accumulation of unsold stock as a precursor to your next investment's failure. For Governments, UNHS is a "policy thermostat" that can signal when to stimulate demand before a developer bankruptcy wave hits.
Limitations & Future Outlook
The primary weakness discovered is the "Black Swan Blindness." System Dynamics is excellent at modeling the "internal clock" of an industry but struggles with external shocks like a global financial meltdown or a pandemic.
Future Research Direction: The next step in this field is the integration of Stochastic System Dynamics, where random economic shocks are introduced into the SFD to test market resilience (Stress Testing), much like how modern banks are regulated today.