
Beyond Follower Counts: Measuring Influence via User-Content Bipartite Graphs
Measuring influence in online social network based on the user-content bipartite graph
This paper introduces a directed user-content bipartite graph model designed to quantify influence in online social networks by integrating user status and content popularity. Testing on Pinterest data, it proposes a HITS-inspired iterative algorithm to calculate "Influence" scores for users and "Reach" scores for content boards, achieving effective identification of top influencers and viral topics.
TL;DR
Follower counts are a "vanity metric" that often obscures true social power. This paper proposes a math-heavy but intuitive solution: treating social networks as a bipartite graph of users and content. By analyzing how influential users engage with specific boards, the authors develop an iterative algorithm that simultaneously ranks user Influence and content Reach, providing a far more accurate map of information flow than simple centrality measures.
Problem & Motivation: The Homogeneity Trap
In the early days of social network analysis, we treated everyone the same—as nodes in a flat web. But platforms like Pinterest or Instagram are heterogeneous. A user is not just a person; they are a creator of "Boards" or "Threads."
Existing SOTA methods like PageRank or HITS often miss the nuances of why a piece of content goes viral. Is it because the person is famous (status), or because the content is genuinely good (quality)? The authors argue that influence is a feedback loop: Influential users create successful boards, and successful boards attract influential users.
Methodology: The Bipartite Intuition
The researchers model the network as , where is partitioned into Users () and Boards ().
1. The Core Metrics
- Success: How many pins on a board are actually repinned? If a board has 100 pins and 80 are repinned, it has high "Success."
- Engagement: Among all boards a user follows, which one do they give the most attention to?
- Activity: How much does a creator focus on a specific board versus their other boards?
2. The Iterative Algorithm
The algorithm functions similarly to the HITS (Hyperlink-Induced Topic Search) algorithm but adapted for this two-mode network.

The logic follows two recursive definitions:
- Reach(Board) = (User Influence User Engagement)
- Influence(User) = (Board Reach User Activity)
Through a Markov chain approach, the authors prove that these scores eventually converge to a stable stationary distribution, ensuring the rankings are mathematically sound.
Experiments & Results: Quality Over Quantity
The study analyzed a real-world Pinterest dataset comprising ~4,000 users and ~80,000 boards.
Key Developer/Brand Insights:
- Influence Popularity: The user "Perfect Palette" ranked 3rd in Influence despite having significantly fewer followers than others in the Top 10. This indicates their content has a much higher "Reach" per follower.
- Topic Specialization: By running the algorithm on subgraphs, the authors successfully identified topic-specific KOLs in niches like "Wedding," "Travel," and "Tech."
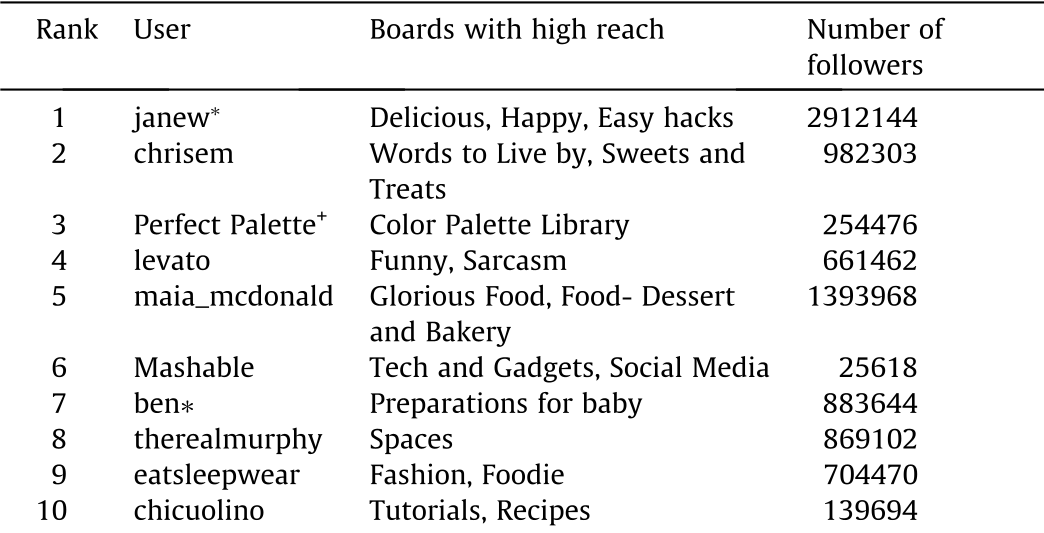 Table 1: Influence rankings showing co-founders (janew, ben) and top brands (Mashable).
Distribution Analysis
The authors also observed that Pinterest drives extreme engagement, with over 55% of users possessing more than 100 pins, creating a "long tail" of content that feeds the influence model.
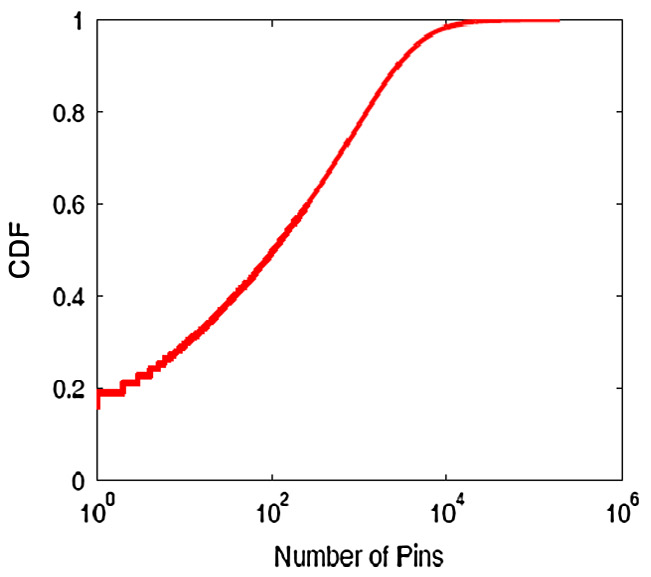 Fig 2: CDF of user activities (pins, boards, and categories).
Critical Analysis & Conclusion
Takeaway
This bipartite approach is a significant step forward for Viral Marketing and Personalized Recommendations. Instead of recommending content based on what is globally popular, platforms can recommend content that is "Success-heavy"—content that manages to capture the attention of already influential users.
Limitations
While powerful, the model assumes a "closed loop" of influence. It does not account for external factors (e.g., a celebrity tweeting a Pinterest link) or the temporal decay of influence (old viral content losing relevance).
Future Outlook
The next frontier is applying this bipartite logic to cross-platform influence—for example, mapping how a TikTok trend flows into Pinterest boards. As social commerce grows, quantifying the "Reach" of specific content collection boards will become the gold standard for ROI in digital advertising.