
Measuring the Pulse of Social Cascades: Moving Beyond Structural Metrics
How to Measure the Information Diffusion Process in Large Social Networks?
The paper proposes a novel set of dynamic metrics—Scope, Speed, and Failure—to quantify the information diffusion process in large-scale social networks. Using an Erdos-Renyi graph model with 100k nodes, the study specifically evaluates a pull-based diffusion strategy incorporating a "time-to-recovery" (TTR) parameter.
TL;DR
Information diffusion isn't just about "who knows who"; it's about the timing and persistence of the message. This paper challenges static network metrics by introducing a dynamic framework of Scope, Speed, and Failure. By simulating 100,000-node networks, the research proves that a node's "Time-to-Recovery" (how long it stays active) and local "activation thresholds" are the true engines of a viral cascade.
Context: Why Static Metrics Fail us
In the study of social networks, we often rely on "Centrality"—identifying the most connected people. However, in a massive, shifting network, static measurements like Betweenness Centrality are computationally expensive (O(n³)) and ignore the most important factor: Time.
The author argues that knowing the network's shape isn't enough to predict a "black swan" event where a small change causes a total system collapse. We need metrics that capture the flow, not just the plumbing.
The Methodology: The "Scope-Speed-Failure" Framework
The paper shifts focus from static topology to a pull-based strategy of diffusion. In this model, a node becomes "infected" (informed) if its neighbors' influence exceeds a set threshold ().
Key Innovation: Time-to-Recovery (TTR)
Most models assume a node is either active or not. The author introduces TTR: the number of steps a node remains "infectious" to others.
The metrics proposed to track this are:
- Scope: The standardized number of successfully reached nodes.
- Speed: The rate at which the diffusion covers the graph.
- Failure: The rate of unsuccessful infection attempts—a critical "friction" metric often ignored.
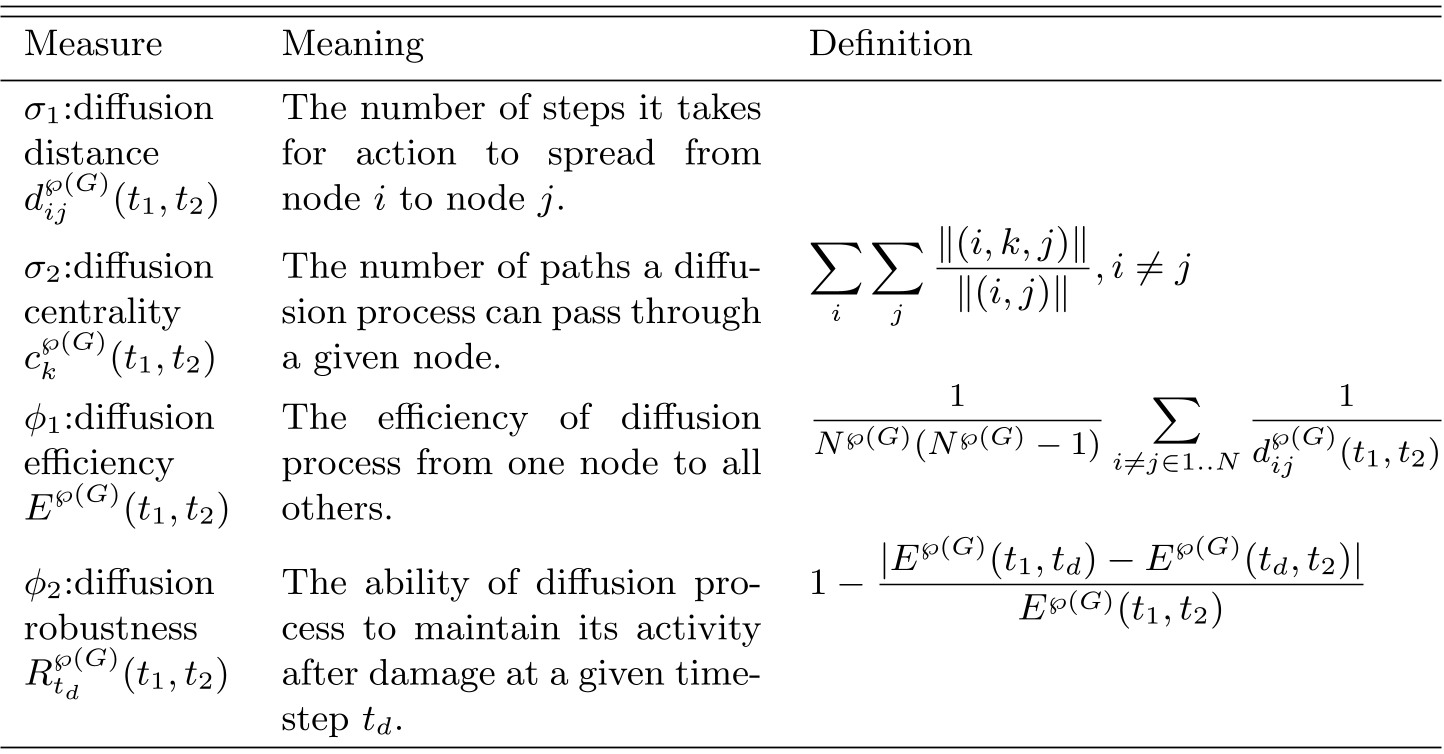 Table 1: Definitions of Diffusion Distance, Centrality, Efficiency, and Robustness.
Experimental Insights: Thresholds and Persistence
The research utilized an Erdős-Rényi (ER) random graph with 100k nodes and an average degree of 3. The simulation revealed several non-intuitive behaviors:
- The Threshold Wall: When the resistance threshold () is low (0.1), the message occupies 90% of the network almost instantly. As approaches 0.9, the "Failure" rate climbs, causing the "Speed" to plummet and limiting total "Scope" to under 45%.
- The TTR Multiplier: Perhaps the most actionable finding is that increasing the Time-to-Recovery (TTR) is more effective than simply increasing the number of initial "seed" nodes. With a TTR of 5 or more, the diffusion process reaches its peak 25% faster.
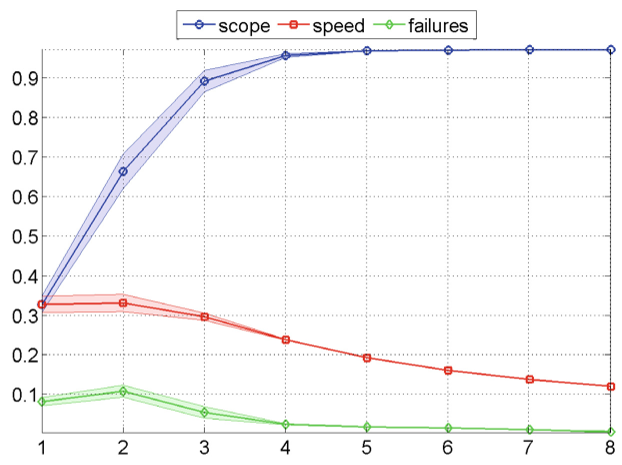 Figure 1: Evolution of Scope, Speed, and Failure across different resistance thresholds (). Note how Speed (green) collapses as Failure (red) rises.
Critical Analysis & Takeaways
The strength of this work lies in its computational pragmatism. By focusing on Scope and Speed via simulation, it provides a "dashboard" for social informatics that structural metrics cannot offer.
Limitations
- Random Graph Simplicity: The Erdős-Rényi model lacks the "Clustering" found in real human social networks (where friends of friends are likely friends). The author acknowledges this, suggesting Random Graphs with Clustering (RGC) for future work.
- Strategy Bias: The paper focuses on a "pull" strategy (nodes seeking info). In real-world marketing or misinformation, "push" strategies (nodes forcing info) or hybrids are more common.
Conclusion
If you want a message to go viral, don't just focus on "influencers" (Degree Centrality). Focus on persistence (TTR) and lowering the activation barrier (Threshold). This paper provides the mathematical vocabulary—Scope, Speed, and Failure—to finally measure why some cascades explode while others fizzle out.