
Beyond Access Control: Measuring the "Discoverability" of Your Social Data
Towards Measuring Knowledge Exposure in Online Social Networks
The paper introduces a novel metric for measuring "knowledge exposure" in Online Social Networks (OSNs), quantifying how discoverable specific information is based on user interface design. By modeling OSN navigation as a graph and applying a personalized PageRank algorithm, the authors rank the visibility of knowledge items such as friendships and user names.
TL;DR
Privacy isn't just about who has permission to see your data; it's about how easy it is for them to find it. This paper introduces a "Knowledge Exposure" metric that uses graph link analysis (similar to Google's PageRank) to calculate the visibility of information in social networks, proving that interface features like News Feeds drastically alter our privacy landscape even when access permissions remain unchanged.
The Visibility Paradox: Why "Public" is a Spectrum
In the early days of Facebook, users were outraged by the introduction of the News Feed. The paradox? The information shown in the feed was already accessible to those users. The difference was effort. Before the feed, you had to manually visit a profile; after the feed, the data was pushed to you.
Current privacy research often falls into the trap of binary logic: either a user is authorized to see a data point, or they aren't. This paper argues that this is insufficient. There is a fundamental difference between a "hidden" friendship buried on the 10th page of a friend list and a "featured" friendship at the top of a personalized homepage.
Methodology: The Anatomy of Exposure
The authors break down their measurement into two interconnected structures:
- Knowledge Graph (): A representation of the raw data—who is friends with whom, and what their names are.
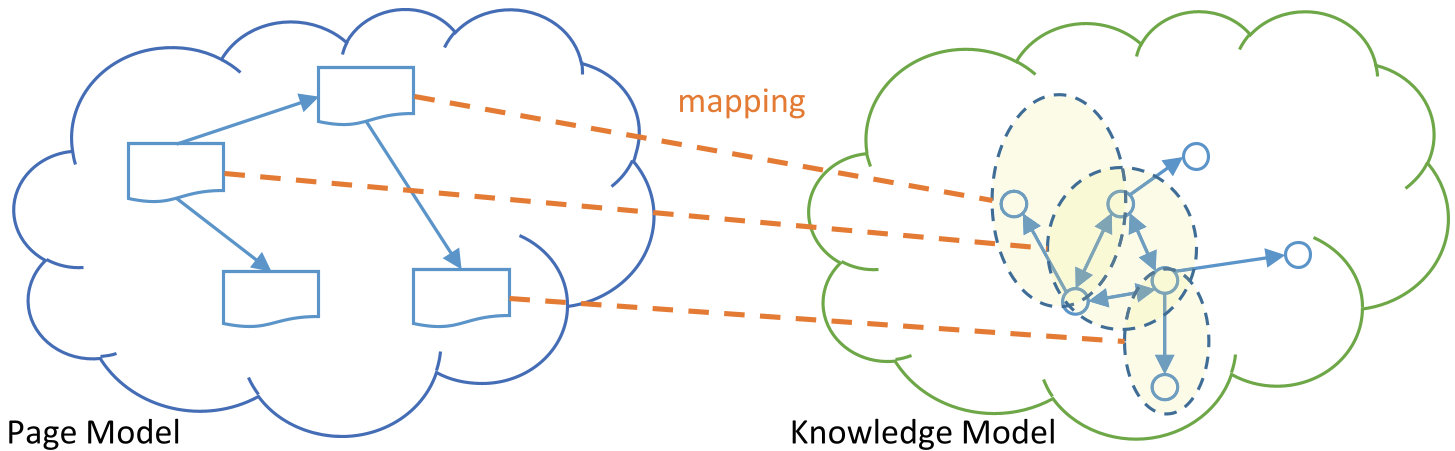
- Navigation Graph (): A model of the User Interface (UI). Instead of treating a whole page as one node, they use "Page Atoms"—small chunks of a page (like a single story in a feed) that link to others.
The Link Analysis Engine
To calculate exposure, the authors treat a social network user like a "random surfer." They apply a personalized PageRank algorithm to the Navigation Graph:
- Teleportation: Users typically start their journey at their unique "Home Page."
- Damping Factor: Reflects the probability of a user getting bored and jumping back to their home page.
- Mapping: The resulting traffic score for each "Page Atom" is then attributed back to the knowledge statements it contains.
Experimental Insights: Feed vs. No-Feed
Using a real-world dataset from Digg (approx. 279k users and 1.7M friendships), the researchers simulated two environments:
- OSN-H: A modern system with a News Feed.
- OSN-NH: A legacy-style system where users only have static profile pages.
Key Findings
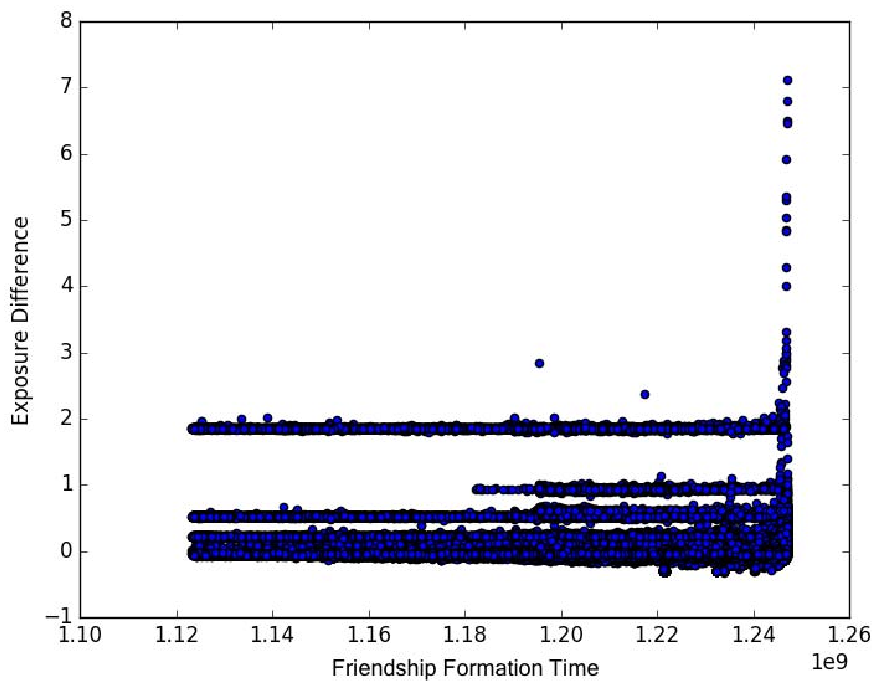
- Recency Bias: In systems with a News Feed, recent friendships have significantly higher exposure scores. Without a feed, time has almost no impact on visibility.
- The "Popularity" Tax: There is a massive correlation between the number of friends a user has and how exposed their name is. Essentially, the more connected you are, the harder it is to remain "unnoticed."
- Quantifiable Differences: The exposure scores in the News Feed scenario were orders of magnitude higher than in the static scenario, confirming that UI design is a more potent determinant of visibility than mere access rights.
Deep Insight: Toward "Soft" Privacy Controls
The industry value of this research lies in its potential for Privacy-Preserving UI Design.
Imagine a privacy setting that doesn't just ask "Who can see this?" but "How much exposure should this get?"
- High Exposure: Push to News Feeds of all friends.
- Low Exposure: Available only if someone manually searches and scrolls through my profile.
By quantifying exposure, platforms could provide users with a "Visibility Dashboard," showing them a heat map of what information about them is currently "glowing" in the network’s UI and allowing them to "cool down" specific facts without deleting them.
Conclusion and Limitations
While this work provides a rigorous mathematical framework for visibility, it currently assumes a basic hyperlink-based navigation. Future iterations will need to account for Algorithmic Recommendations (like TikTok's "For You" page), where the "navigation link" isn't a button clicked by a user, but a decision made by a black-box AI. Nevertheless, this paper marks a critical shift from static access control to dynamic exposure management.