
Measuring Segregation: A Taxonomic Guide to "Birds of a Feather" in Social Networks
Measuring segregation in social networks
This paper provides a comprehensive taxonomic review of social network segregation measures, evaluating 11 distinct indices (including the E-I Index, Assortativity Coefficient, and Spectral Segregation Index) against a rigorous set of structural properties. It introduces a formal framework to distinguish between measures based on whether they prioritize the "contact layer" of a network or the "opportunity structure" of both connected and disconnected dyads.
TL;DR
Not all "homophily" is measured equal. This seminal paper by Bojanowski and Corten deconstructs 11 popular network segregation measures—from the simple E-I Index to complex Spectral Segregation—to reveal how our choice of "mathematical lens" can fundamentally flip our conclusions about whether a society is segregated or integrated.
The Problem: The "Naive Operationalism" Trap
In social science, we often say "people like people who are like themselves." But how do we prove it? Is a network segregated because common types choose each other, or simply because they are the only ones available?
Prior work often failed to distinguish between these two. If you ignore the people who don't have ties (isolates), you might misinterpret a small, cliquish minority as being "integrated" simply because they have few ties overall. The authors argue that without a formal "measurement theory," we are just arbitrarily matching numbers to words.
Methodology: The Three Pillars of a Good Measure
The authors propose that any robust segregation measure must be evaluated through three specific properties:
- Null Models: What does "zero segregation" look like? Is it a purely random graph (Random Network), or does it account for the fact that some groups are just more active than others (Marginal Effects)?
- Insensitivity to Isolates (ISO): If we add 10 people to a network who have no friends, does the segregation score change? If the measure only looks at existing friendships (the contact layer), it stays the same. If it looks at potential friendships, the score shifts.
- Symmetry (SYM): If we double the population and double the ties, does the segregation level stay the same?
The Core Insight: Two Schools of Thought
The paper effectively splits all measures into two camps based on the researchers' "Physics of the World":
- The Contagion View: The network is a fixed "pipe" (e.g., family trees). We measure how a trait (like a disease or opinion) spreads. Use: Assortativity Coefficient, CLLM.
- The Selection View: People are fixed, and they choose their friends. We measure the act of choosing. Use: Freeman’s Index, ERGMs, Coleman’s Index.
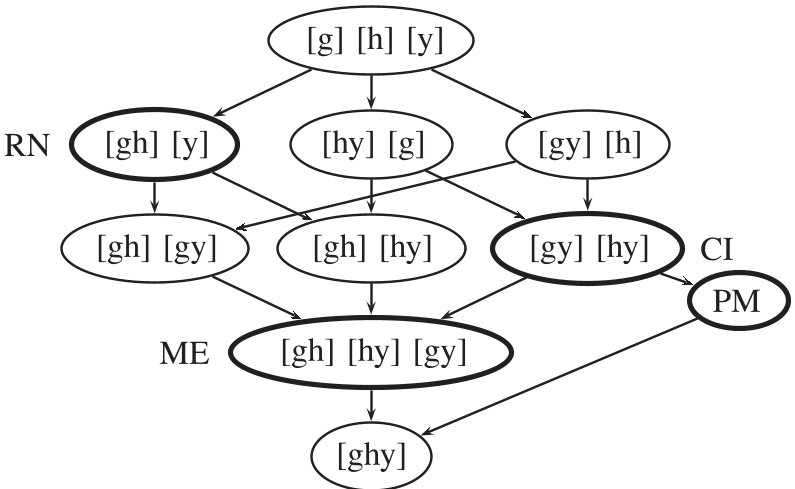 Figure 1: The hierarchy of null models reveals how nested constraints (from simple independence to marginal effects) dictate the "zero point" of segregation indices.
Comparing the Heavyweights
The authors applied these measures to four datasets, including White’s Kinship Network and a Physician Friendship Network.
| Index | Null Model | Sensitive to Isolates? | Logic |
|---|---|---|---|
| E-I Index | None | No | Simple count of internal vs external ties. |
| Assortativity | Proportionate Mixing | No | Evaluates the "weight" of the diagonal in the mixing matrix. |
| Freeman's | Random Network | Yes | Compares observed ties to a random baseline. |
| SSI | None | Yes | Uses eigenvalues to find deep-seated "cores" of segregation. |
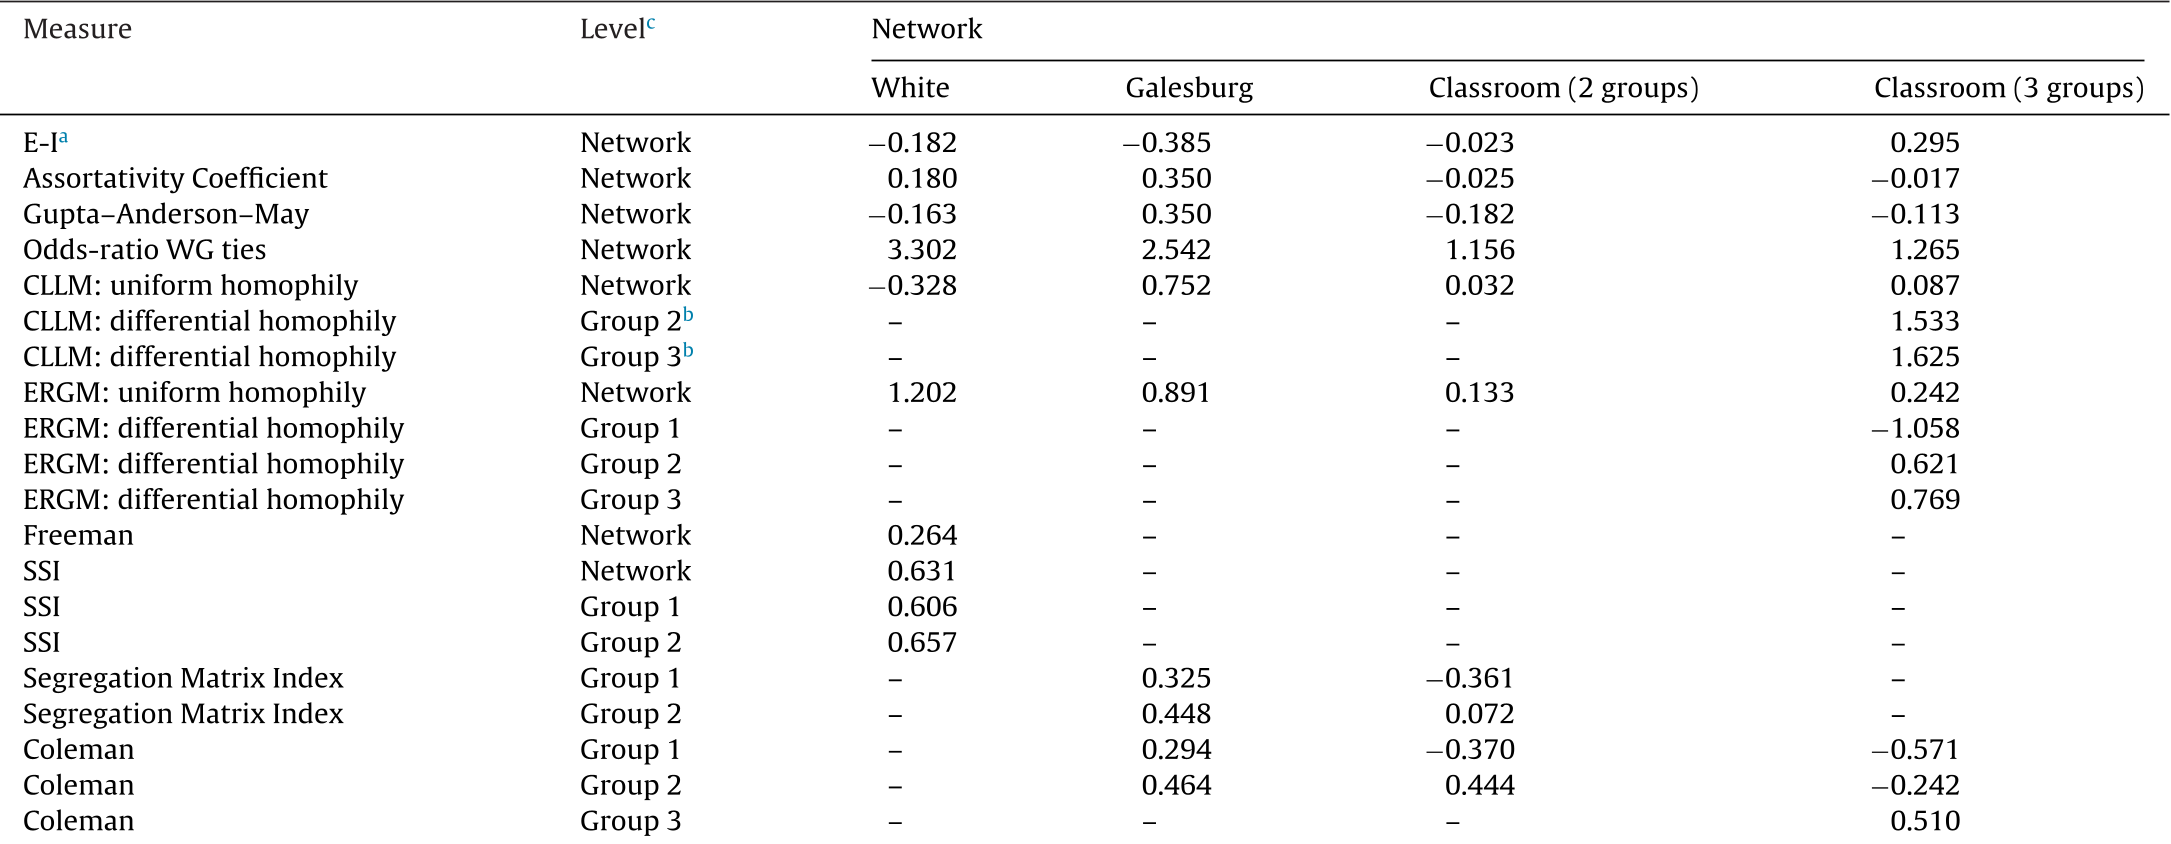 Figure 2: Empirical results showing how different measures (rows) produce varying scores for the same networks (columns). Note the flip in indicators for White's network.
Deep Insight: Why Isolates Matter
One of the most profound takeaways is the ISO property. In a city with growing minority populations, adding "lonely" newcomers actually increases the opportunity for integration. Measures that satisfy ISO (like Newman's Assortativity) are blind to this growth because they only care about successful connections. If your research goal is to study social exclusion, you must use a measure that fails the ISO property—one that registers the "social silence" of isolates.
Critical Analysis & Conclusion
Takeaway
There is no "perfect" index. If you are studying how a virus spreads in a static city, use the Assortativity Coefficient. If you are studying why people of different races don't become friends in a new school, use ERGM-based homophily effects or Freeman’s Index.
Limitations
The authors note that while these measures are descriptive, they often lack a behavioral interpretation. They describe the "what" (the state of the network) but struggle to isolate the "why" (the psychological or structural drive).
Future Outlook
The next frontier is Axiomatic Characterization—mathematically proving that a specific set of requirements leads to one, and only one, valid measure. Until then, researchers must be "theoretically grounded" before they ever touch their dataset.