
Decoding Online Social Habits: A Large-Scale Statistical Analysis of OSN Behavior
7208_Measuring user behavior in online social networks.
This paper presents a large-scale measurement study of user behavior across four major Online Social Networks (OSNs): Bebo, MySpace, Netlog, and Tagged. Using a custom crawler deployed on over 500 PlanetLab nodes, the authors monitored 80,000 users over six weeks to characterize activity patterns, session durations, and loyalty.
TL;DR
How much time do we actually spend on social media, and are our habits predictable? This study monitors 80,000 users across Bebo, MySpace, Netlog, and Tagged to reveal the mathematical "fingerprint" of social networking. By using a distributed measurement framework, the researchers discovered that user loyalty decays rapidly and that our online sessions can be precisely modeled using Weibull and Power Law distributions.
Contextualizing User Centricity
While most academic work in the late 2000s obsessed over the "Social Graph" (who is friends with whom), this paper argues that the graph is static and lacks the "pulse" of the network. The real value of an OSN lies in activity. However, this data is a "black box" owned by corporations. The authors break this barrier by treating public profile pages as a sensor network, providing a rare look into the temporal dynamics of user engagement.
Pain Points: The Visibility Gap
Market research firms like comScore often provide "average monthly data," which masks the volatility of individual behavior. For system architects, averages are useless; they need to know the burstiness of logins and the distribution of session lengths to prevent server crashes. The challenge was: how do you collect high-frequency (1-minute resolution) data at an "Internet-scale" without being blocked or needing a massive data center?
Methodology: The "Poor Man's" Global Monitor
The researchers utilized PlanetLab, a global research network, to deploy scripts across 500+ nodes.
The Polling Engine
By checking a user's "Online Status" every minute, they reconstructed "up-time" blocks.
- Innovation: To scale MySpace monitoring, they exploited the "Friends' Status" page, which allowed them to track hundreds of users via a single HTML request.
- The Timeout Factor: They cleverly identified that session "jumps" in the data revealed the internal server timeout settings of the platforms (e.g., 30 mins for Bebo, 20 mins for MySpace).
 Figure 1: The architecture of the PlanetLab-based measurement framework.
Key Insights: The Math Behind the Scroll
1. The Weibull Distribution of Time
The study found that the total time a user spends online isn't random. It follows a Weibull distribution. This implies that human behavior in these digital spaces has a high degree of "predictable variance," allowing engineers to simulate user load with high accuracy.
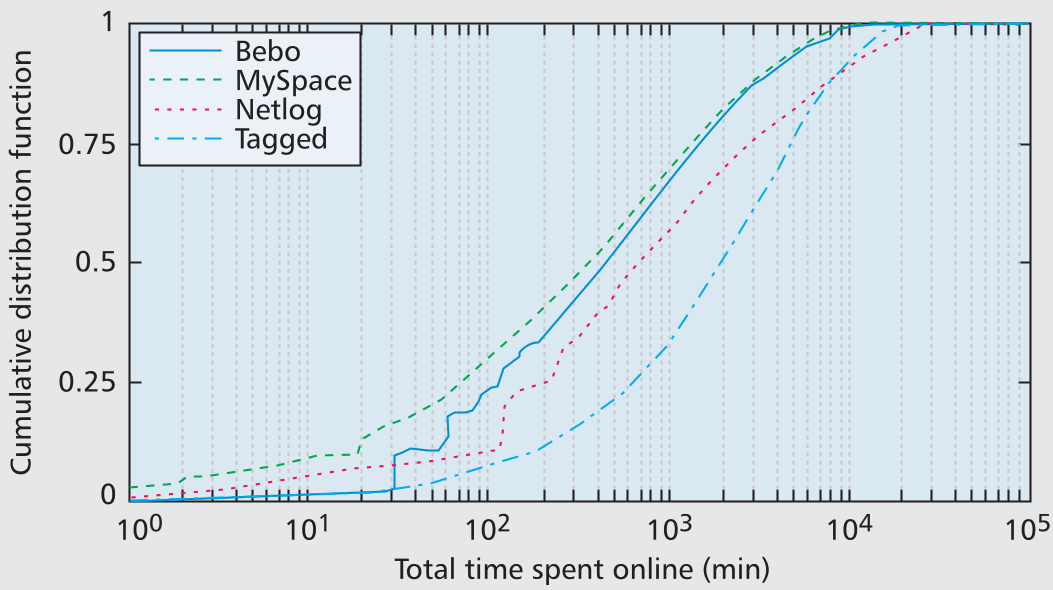 Figure 2: P-P plot showing the near-perfect alignment of MySpace usage data with a Weibull distribution.
2. The "Miracle Lasts Three Days" (User Loyalty)
In a cohort of newly joined MySpace users, active engagement dropped by nearly 40% within just six weeks. This "interest decay" is a critical metric for "Seeding Firms" and advertisers; it suggests that the "honeymoon phase" of a new social platform is incredibly short.
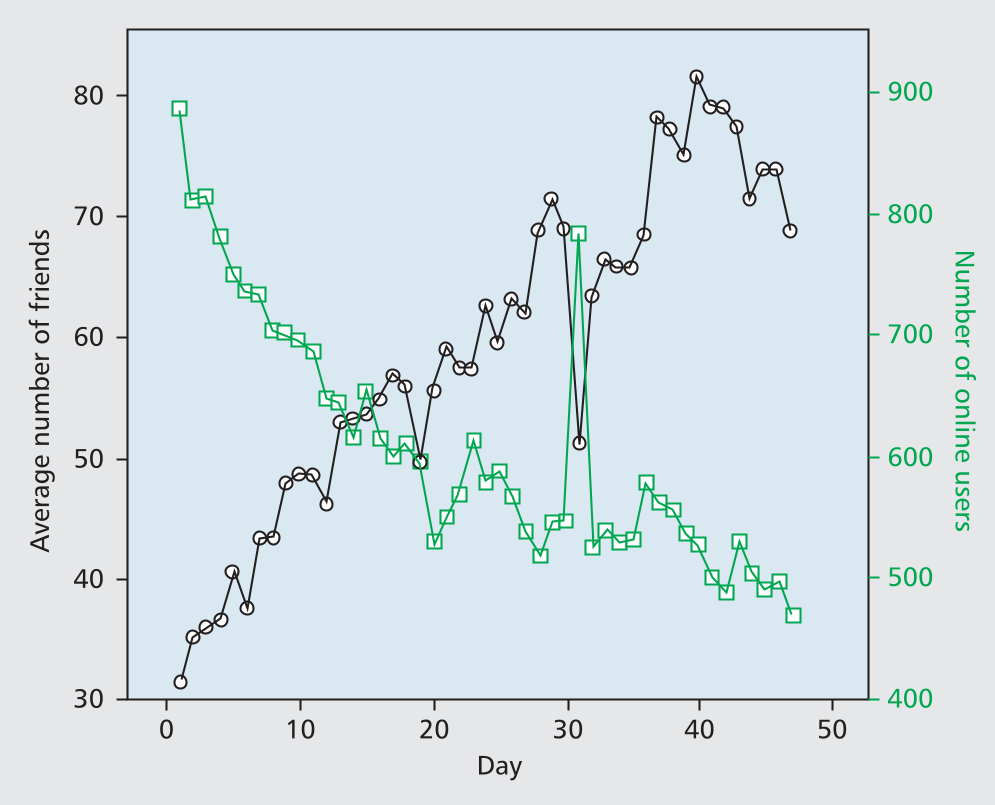 Figure 3: Longitudinal tracking of active users showing a steady decline in daily participation.
3. Power Law Sessions
Both session durations and the number of logins follow a Power Law. This means a small number of "super-users" account for a massive, disproportionate amount of the total network activity—a classic "long tail" phenomenon.
Critical Analysis & Future Outlook
Takeaway: This work provides the statistical bedrock for OSN resource allocation. By knowing that login intensity follows a Power Law, providers can better manage "thundering herd" login events.
Limitations:
- Session Noise: The study's reliance on "Online Status" is skewed by how users leave the site (proper logout vs. just closing the tab).
- Sampling Bias: While 80,000 is large, it represents a snapshot of the late 2000s; modern "always-on" mobile app behavior likely differs from these web-based traces.
Future Implications: As we move toward the Metaverse or decentralized social networks, these "in-depth" behavioral distributions remain the golden standard for simulating whether a new architecture can survive real-world human chaos.