
Media Watch on Climate Change: Decoding Global Environmental Discourse through Visual Analytics
Media Watch on Climate Change -- Visual Analytics for Aggregating and Managing Environmental Knowledge from Online Sources
The paper presents the Media Watch on Climate Change (MWCC), a visual analytics portal that aggregates and manages environmental knowledge from news media, blogs, social platforms, and corporate sites. It utilizes the webLyzard platform to provide real-time sentiment analysis, geospatial mapping, and semantic clustering of climate-related discourse.
TL;DR
The Media Watch on Climate Change (MWCC) is a sophisticated Web intelligence portal designed to break down information silos in environmental science. By aggregating millions of documents from news, social media, and NGOs, it provides a real-time "dashboard" of the global climate conversation. It doesn't just show where climate change is being discussed, but how it is perceived—using sentiment analysis and 3D semantic landscapes to guide policy and public outreach.
Problem & Motivation: The Silo Effect in Climate Science
Despite the urgency of the climate crisis, knowledge remains fragmented. Scientists, NGOs, and corporations often communicate in "monological habits," leading to a lack of shared meaning. Decision-makers face two primary hurdles:
- Data Heterogeneity: Reconciling formal scientific reports with the chaotic, emotional streams of Twitter (X) and Facebook.
- Complexity & Risk: Understanding how public opinion develops and identifying relevant opinion leaders in real-time.
The authors argue that a "content hub" is necessary to provide transparency and move from conflict to consensus-building.
Methodology: The webLyzard Engine
The core of MWCC is the webLyzard platform, which acts as a pipeline for unstructured evidence. The system's power lies in its Multiple Coordinated Views (MCV)—where a filter applied to a sentiment chart instantly updates geographic maps and semantic tag clouds.
1. Semantic Topography (Information Landscapes)
Instead of a simple list of search results, MWCC uses "Information Landscapes." This 3D visualization represents semantic similarity: peaks represent high-density document clusters on a specific topic, while valleys indicate sparse coverage.
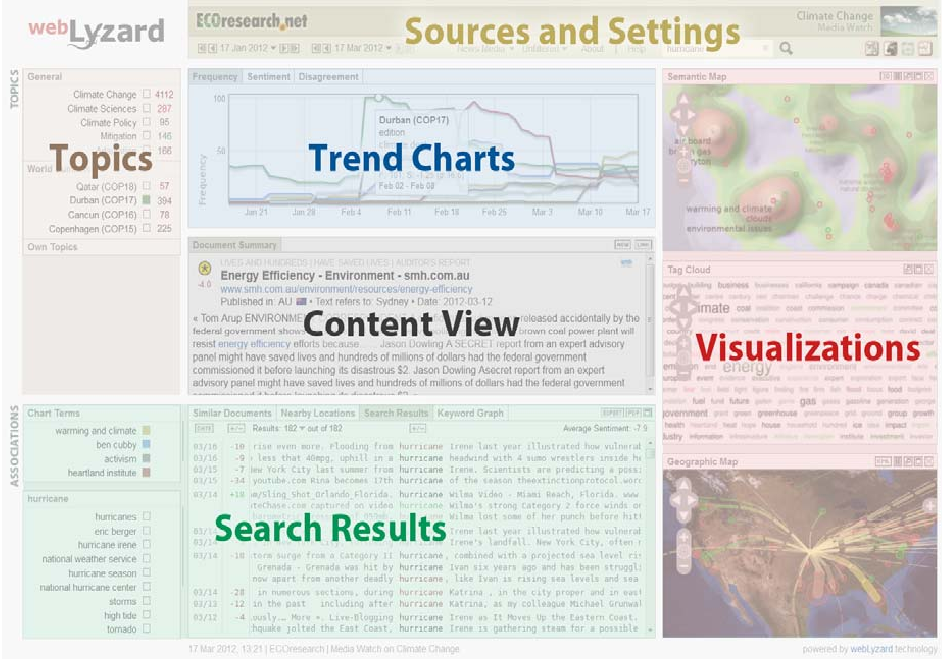 Figure 2: Overview of the MWCC visual dashboard elements.
2. Geotagging & Sentiment Mapping
Every document is geo-tagged to extract both its source geography (where it was published) and target geography (where it refers to). The system automatically computes "disagreement" by measuring the standard deviation of sentiment, identifying which environmental issues are the most contested.
Experiments & Key Insights
The researchers applied MWCC to major events like the Rio+20 conference. Their comparative analysis of sources yielded striking results:
- Source "Spin": News media typically maintains a balanced sentiment. Social media exhibits a negative, emotional slant. Corporate sites (Fortune 1000) show an overwhelmingly positive bias toward their own sustainability efforts.
- Real-time Tracking: The "News Flow Diagram" (a combination of falling blocks and arcs) allows users to see themes emerge and vanish in a dynamic animation.
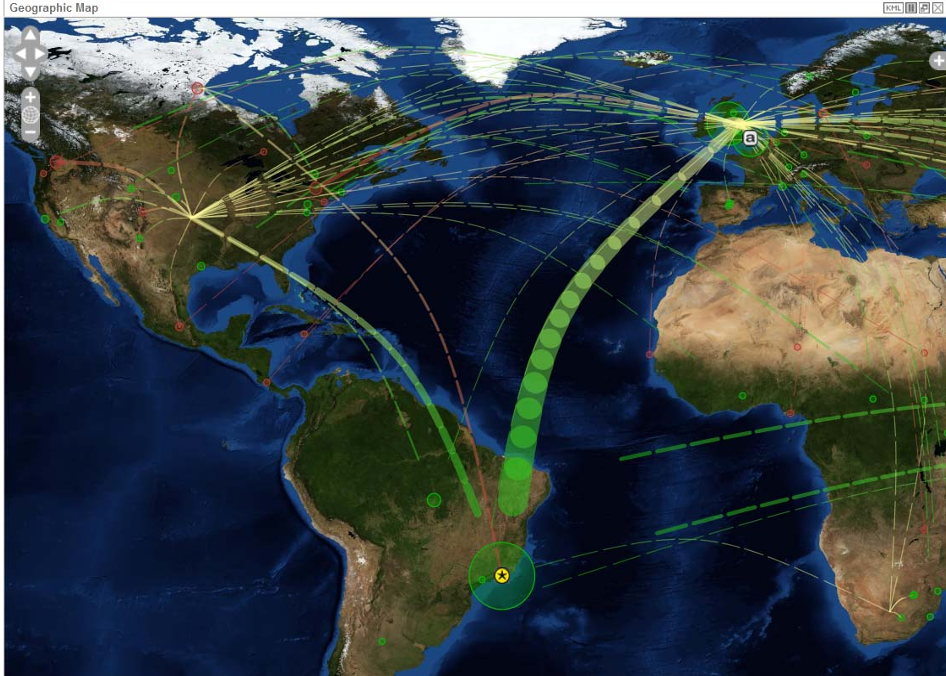 Figure 7: Comparison of "Spin" across media types using sentiment-coded tag clouds.
Critical Analysis & Conclusion
The MWCC represents a significant leap in Environmental Informatics. By moving beyond simple keyword search to a multi-dimensional analysis of attitude and context, it provides a tool for "Environmental Democracy."
Limitations & Future Work:
- Linguistic Ambiguity: While the sentiment engine is optimized, human language—especially irony and sarcasm in social media—remains a challenge.
- Evaluation: The authors plan to transition from heuristic expert reviews to formal Eye Tracking studies to measure how users actually process these complex visual landscapes.
Ultimately, this work proves that managing environmental knowledge is not just about storing data; it’s about visualizing the human face of Big Data.
Summary Information
- Core Achievement: SOTA visual analytics for climate discourse.
- Key Metrics: Real-time processing of millions of documents; automated sentiment & geo-tagging.
- Industry Value: High for public relations, policy makers, and NGOs seeking to measure outreach effectiveness.