
SimTree: Minimizing Data Center Traffic by Exploiting Self-Similarity in Social Interactions
Minimizing Inter-Server Communications by Exploiting Self-Similarity in Online Social Networks
The paper proposes a novel data placement strategy for Online Social Networks (OSNs) that minimizes inter-server communication by exploiting the "self-similarity" found in interaction graphs. By partitioning users into communities based on actual interaction frequency rather than just social links, and mapping these to data center servers, the approach significantly outperforms standard DHT-based random partitioning and social-graph-based methods.
TL;DR
Online Social Networks (OSNs) like Facebook struggle with massive inter-server traffic because user data is often scattered randomly across data centers. This paper reveals a hidden "fingerprint" in how humans interact: the Interaction Graph is self-similar. By leveraging this fractal-like structure, the authors developed SimTree, a data placement strategy that slashes inter-server traffic by up to 80% and significantly reduces latency compared to industry-standard consistent hashing.
The "Randomness" Trap in Large-Scale OSNs
Most modern OSNs rely on DHT-based key-value stores (e.g., Apache Cassandra). To achieve massive scalability, they use random partitioning—consistent hashing—to distribute user data across thousands of servers.
While this is great for load balancing, it is a disaster for data locality. When you post a status update, your data might live on Server A, but your 50 active friends' data are scattered across Servers B through ZZ. This creates a "scatter-gather" nightmare where a single user action triggers a cascade of inter-server communications.
Previous attempts tried using Social Graphs (who is friends with whom) to group users. However, the authors argue this is "fools' gold." Why? Because social links are static and noisy—most people don't actually interact with 80% of their "friends."
The Insight: Self-Similarity in Interaction
The core contribution of this paper is the discovery of Self-Similarity in the OSN interaction graph. By analyzing 24 million Facebook interaction events, the authors found that user interactions aren't just clustered; they are organized in a recursive, hierarchical structure that resembles natural systems like river networks.
Using the Horton-Strahler (HS) index—a mathematical tool used to measure the branching complexity of trees—they proved that interaction graphs maintain a constant bifurcation ratio (). This structure is known in physics to be the "path of least resistance" for energy/cost dissipation.
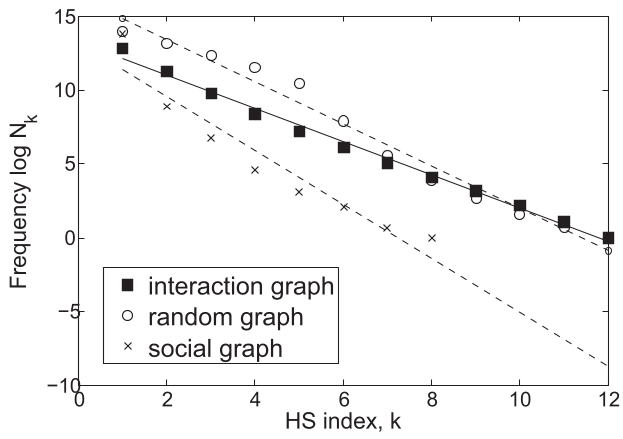 Figure: The interaction community tree showing how users merge into fractal-like clusters.
Methodology: The SimTree Algorithm
The authors proposed a two-step approach:
- Locality Optimization: Using a greedy heuristic to maximize the Modularities (Q-value). This identifies "interaction communities" where users talk to each other frequently.
- Self-Similar Placement (SimTree): Once an interaction community tree is built, the algorithm performs "sub-tree cutting." It finds the largest possible sub-tree that fits into a server's capacity. This ensures that the most tightly-knit interaction groups stay on the same physical hardware.
Unlike static partitioning, they also introduced an Incremental Adjustment mechanism to handle new users and changing friendships without recomputing the entire global state.
Experimental Results: Death to Latency
The trace-driven simulations (using a fat-tree data center topology in NS-2) show a clear victory for self-similarity-based placement.
Key Comparisons:
- Baseline: Cassandra (Random Partitioning)
- Competitor: "Little Engine" (Social Graph Partitioning)
- The Winner: SimTree (Interaction Graph + Self-Similarity)
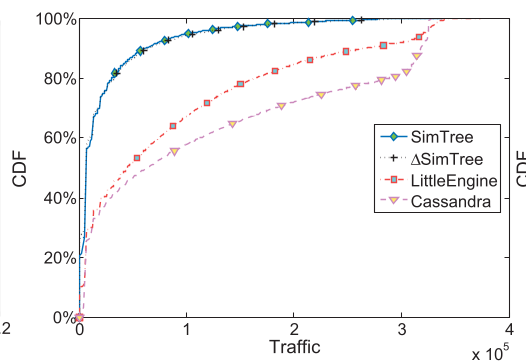 Figure: Comparison of traffic generated by 'Wall Post' operations.
Results Summary:
- Traffic Reduction: Profile updates saw a staggering 80.3% reduction in network traffic compared to Cassandra.
- Latency Improved: User login and wall post latencies dropped by roughly 37-56%, as the system avoided multiple network hops to fetch friend data.
- Scalability: As the number of servers scaled from 16 to 1024, the "SimTree" approach maintained a significant margin of efficiency over existing SOTA methods.
Critical Analysis & Takeaways
The brilliance of this work lies in moving away from the "Social Graph" (the potential for interaction) to the "Interaction Graph" (the reality of interaction).
Limitations: While powerful, the approach requires constant monitoring of user interactions to keep the "Interaction Graph" fresh. If a user suddenly changes their best friend, the "Incremental Adjustment" must be efficient enough to migrate data without causing its own traffic spike.
Future Outlook: This paper opens the door for physics-inspired systems design. If human behaviors in digital spaces follow fractal and self-similar patterns, we should stop building "flat" distributed systems and start building "hierarchical, organic" ones.