
Decoding Weather Patterns: Using Spatial Clustering to Track Mesoscale Convective Systems
Mining the Features of Environmental Physical Field Influencing Trajectories of Mesoscale Convective Systems Based on Spatial Clustering Analysis
This paper introduces an automated spatial data mining framework to analyze Mesoscale Convective Systems (MCS) over the Tibetan Plateau. It utilizes the CLARANS spatial clustering algorithm to identify environmental physical field patterns—specifically vorticity, divergence, and vertical wind velocity—that drive the eastward trajectory of MCS toward the Yangtze River Basin.
TL;DR
Meteorologists have long known that the Tibetan Plateau acts as a "weather engine" for China, but predicting how storms move off the plateau is notoriously difficult. This paper employs the CLARANS spatial clustering algorithm to mine atmospheric data, revealing that specific configurations of vorticity, divergence, and vertical wind are the "hidden signatures" that propel dangerous convective systems toward the Yangtze River Basin.
Problem & Motivation: The Plateau’s Hidden Engine
The Yangtze River Basin frequently suffers from catastrophic flooding caused by Mesoscale Convective Systems (MCS). Many of these systems originate over the Tibetan Plateau, where unique topography creates complex thermal and dynamic fields.
Traditional numerical weather models often struggle with these transitions because:
- Complexity: Atmospheric dynamics involve non-linear interactions across multiple scales.
- Accuracy Gap: Simulations frequently deviate from observed satellite data.
- Data Overload: While we have vast amounts of satellite (GMS) and forecasting (HLAFS) data, effectively "mining" this data for actionable patterns is an ongoing challenge in atmospheric science.
Methodology: Mining the "Environmental Physical Field"
The researchers treated the atmosphere not just as a fluid system, but as a spatial database. Their workflow involves two critical steps:
1. Automatic MCS Tracking
Using Geostationary Meteorological Satellite (GMS) data, the team tracked connected pixels with temperatures (). By monitoring these over consecutive hours, they identified the trajectories of 749 MCS cases precisely.
2. CLARANS Clustering
Standard clustering often fails with large spatial datasets due to outliers. The authors chose CLARANS (Clustering Large Applications based upon RANdomized Search), a medoid-based partitioning method. They extracted grids of dynamical data (vorticity, divergence, and vertical velocity) surrounding the MCS centers and used CLARANS to find "representative" environmental states for different stages of the storm's life.
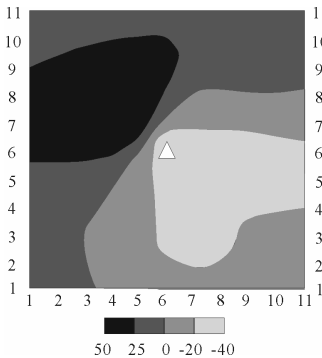 Figure 1: Clustering results of the vorticity field at different stages of MCS development.
Results: The Anatomy of a Moving Storm
The analysis revealed a high degree of spatial organization in the features favoring eastward movement:
- Vorticity (The Rotation): As MCS develop and move eastward, they are consistently flanked by positive vorticity centers to their west (up to 78% of cases). This configuration suggests that strong eastward positive vorticity flow acts as the primary steering mechanism.
- Divergence (The Breathing): At the origination stage, convergence (suction) dominates the west of the MCS (74% frequency). However, as the storm prepares to exit the plateau, this shifts to a divergence-heavy state, marking a transition in the storm’s internal structure.
- Vertical Velocity (The Lift): The MCS is essentially "glued" to zones of intensive airflow lifting. The maximum lifting velocity peaks at approximately during the development phase.
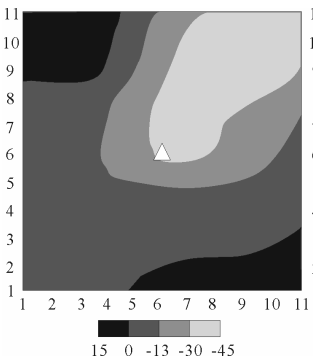 Figure 2: Spatial distribution characterizing the vertical wind velocity field (W) during MCS propagation.
Critical Analysis & Conclusion
Takeaway
The paper successfully proves that spatial data mining can bridge the gap between "raw meteorological data" and "forecasting insights." By Identifying that MCS movement is dependent on the west-side positioning of positive vorticity and convergence zones, it provides specific "markers" for meteorologists to watch.
Limitations & Future Work
While CLARANS is robust against outliers, the study relies on a dataset from 1998. Modern updates using higher-resolution sensors (like Himawari-8/9) and incorporating Machine Learning (CNNs/LSTMs) could likely refine these clusters even further. The authors suggest that the next step is building actual predictive numerical models based on these mined features, moving from retrospective analysis to real-time disaster prevention.
This research marks a significant step in transforming meteorology from a purely simulation-based field into a sophisticated data-mining discipline.