
Mining Social Groups via Wireless Detection: Beyond Traditional Wi-Fi Logs
Mining Social Groups in Campus Based on Wireless Detection
This paper introduces a campus social group mining framework using a passive wireless detection method to capture mobile terminal trajectories without requiring network login. By defining a unique "Meeting Time Grid" and applying bottom-up clustering with social network graph analysis, it identifies distinct social structures such as graduate research labs and undergraduate class groups.
TL;DR
This research moves social network analysis from the digital realm to the physical campus. By deploying passive wireless detectors that sniff MAC addresses without requiring users to log in, the authors successfully mapped the hidden social structures of a university—from tight-knit graduate labs to transient undergraduate class-goers—using a novel "Meeting Time Grid" metric and graph-based clustering.
Context & Positioning
Most studies on mobility rely on AP (Access Point) logs. However, AP logs only tell us who used the internet, not necessarily who moved together. This paper positions itself as a "mobility-first" study, utilizing passive detection to capture 24/7 trajectory data, including outdoor movements, which are often blind spots for traditional campus Wi-Fi network analysis.
The Problem: The "In-Common" Fallacy
Prior work often used simple association matrices: if User A and User B were both seen at Location X, they were associated. This ignores the temporal dimension. If User A was at the library at 9 AM and User B at 9 PM, they didn't "meet."
The authors argue that:
- Meeting frequency matters: More frequent co-locations indicate stronger ties.
- Meeting duration matters: Longer shared time indicates higher intimacy.
- Symmetry isn't guaranteed: The association of A to B might differ from B to A relative to their total individual online time.
Methodology: The Meeting Time Grid
To solve the discrete nature of wireless sniffing (where signals are caught in bursts), the authors introduced the Meeting Time Grid.
By dividing the timeline into 1-minute cells, they transformed discrete pings into a continuous-style representation. This allows for a robust calculation of the Association Degree, which is the ratio of shared time grids to the total grids occupied by a user.
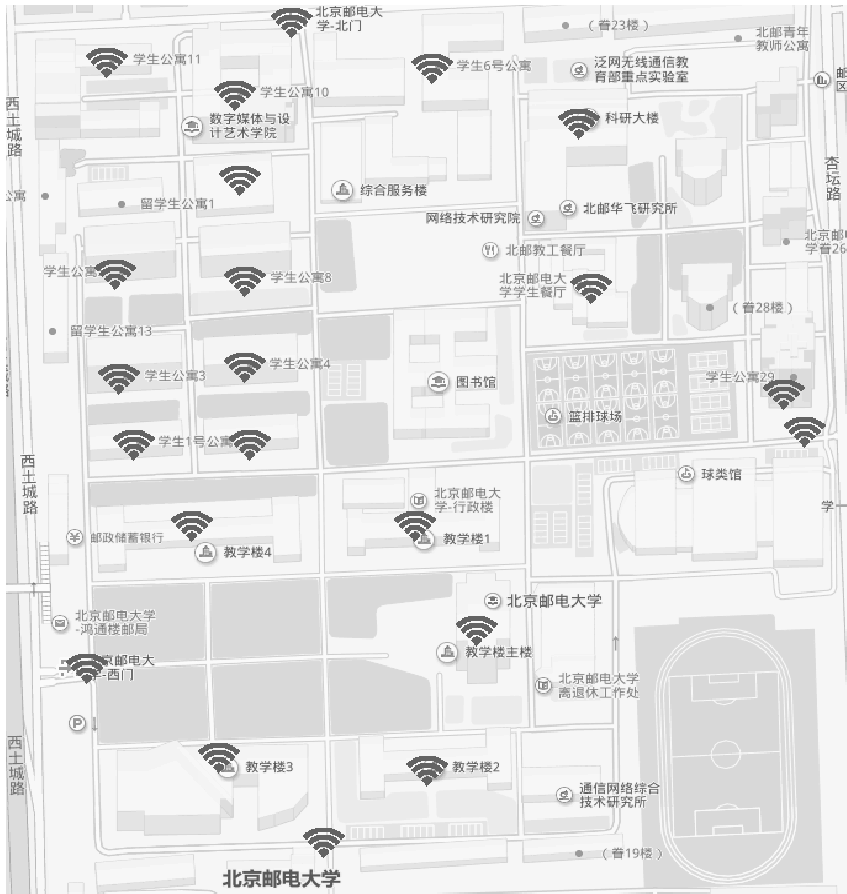 Figure 1: Strategic deployment of Wi-Fi detection devices across teaching buildings, mess halls, and school gates.
The Clustering Logic
The authors used a bottom-up clustering approach:
- Every user starts as their own cluster.
- Similarity is calculated between all pairs.
- The most similar pairs/clusters are merged iteratively until they fall below a 0.1 similarity threshold.
Results & Discovery: The Three Archetypes of Social Groups
The study found that while the network is sparse (only ~3% of users ever "meet"), the connectivity is strong enough to form distinct social subgraphs. By importing results into Gephi, the researchers identified three distinct social structures:
1. Network Intensive Subgraphs
- Characteristics: High node degree, low variance (everyone is connected to everyone).
- Interpretation: Stable groups such as graduate students in the same laboratory or canteen staff. These individuals share the same location for extended periods.
2. Even Dispersion Subgraphs
- Characteristics: Low node degree, low variance.
- Interpretation: Undergraduates. They appear together in teaching buildings for specific classes but have diverse schedules otherwise, leading to "weak" linkages.
3. Circle-Spoke Subgraphs
- Characteristics: High variance, presence of a central "hub" node.
- Interpretation: A central user with very weak mobility (perhaps a receptionist or a student staying in one spot all day) who "encounters" many different mobile users passing through.
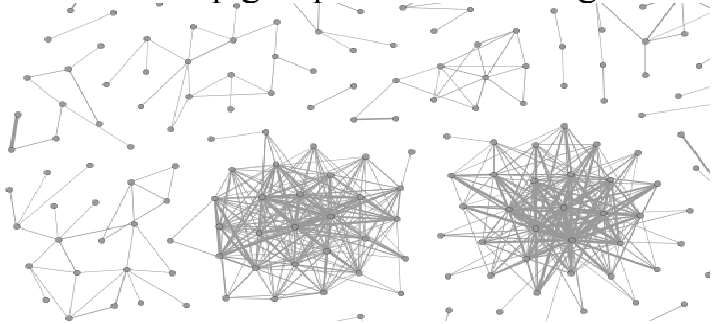 Figure 2: Social network visualization revealing the structural differences between campus groups.
Critical Insight & Limitations
The strength of this work lies in its data collection philosophy. By decoupling from network authentication, the study captures a more authentic "social fingerprint" of the campus.
Limitations:
- Hardware Density: The current deployment missed key social hubs like gyms and cafes, which likely host different social dynamics.
- Qualitative Reliance: The interpretation of subgraphs (e.g., "these are undergraduates") still requires manual observation and external domain knowledge.
Conclusion
This paper demonstrates that your phone’s Wi-Fi "pings" are more than just technical signals—they are the breadcrumbs of your social life. By moving to a time-grid-based association model, researchers can effectively bridge the gap between raw signal detection and meaningful social group mining.